Understanding Different Profitability Analysis Methods
What Is Profitability Analysis? (And Why It Matters More Than Profit Alone)

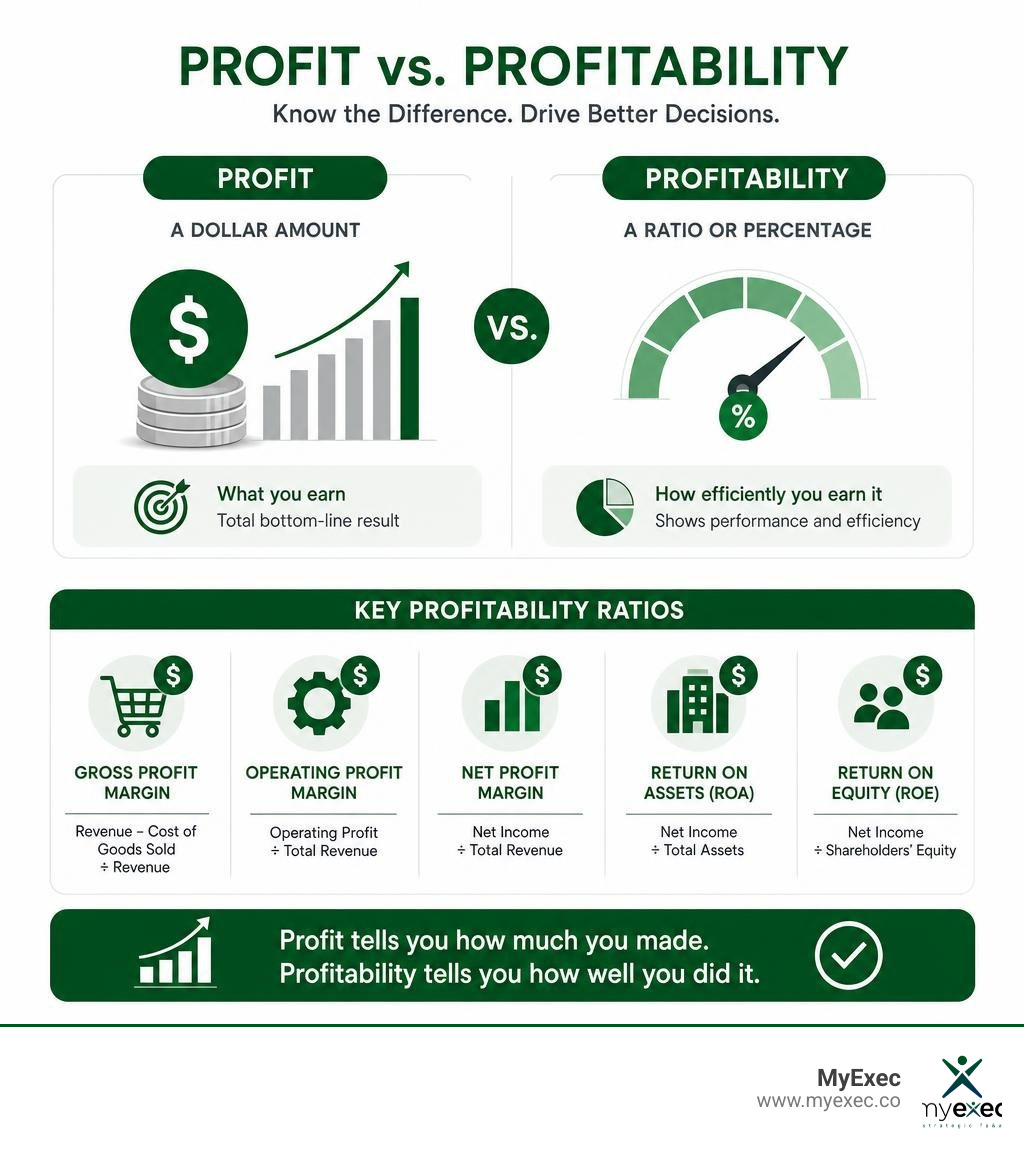
Profitability analysis is the process of examining your revenue streams, costs, and margins to evaluate how efficiently your business generates profit, not just how much profit it makes.
Here's the quick answer if that's all you need:
| Term | What It Is | Example |
|---|---|---|
| Profit | A dollar amount: revenue minus expenses | $200,000 net income |
| Profitability | A ratio: how efficiently you earn that profit | 12% net profit margin |
| Why It Matters | Ratios let you compare performance across time, products, and peers | Is 12% good for your industry? |
The core profitability ratios most businesses rely on:
- Gross profit margin -- revenue minus cost of goods sold, divided by revenue
- Operating profit margin -- operating profit divided by total revenue
- Net profit margin -- net income divided by total revenue
- Return on assets (ROA) -- net income divided by total assets
- Return on equity (ROE) -- net income divided by shareholders' equity
Most CEOs know their top-line revenue. Far fewer know which products, customers, or channels are actually driving that number, and which ones are quietly dragging it down. That's the gap profitability analysis is designed to close. It goes deeper than your income statement to show you where margin is created, where it slips away, and what to do about it.
At MyExec, we have worked across companies from a few million in revenue to roughly $2 billion, including private equity-owned businesses where profitability analysis was central to every capital allocation and strategic planning decision. In the sections below, we will walk you through the methods, metrics, and checklists that matter most for growing businesses.
Why Strategic Profitability Analysis Is Essential for Mid-Market Growth
When a business is small, the founder can often manage cash flow by looking at the bank account. But as you scale past $5M toward $50M in revenue, that approach breaks down. You add multiple revenue streams, complex cost structures, and larger teams. Without a systematic profitability analysis, you risk chasing revenue that actually costs you money to service.
Strategic profit optimization requires looking beyond aggregate numbers. You must understand the underlying profitability of individual business units to identify real growth opportunities, optimize asset utilization, and enhance operational efficiency.
This analysis directly informs critical strategic decisions. For example, should you outsource your manufacturing or keep it in-house? Outsourcing typically increases asset turnover because you get rid of heavy machinery, but it might reduce your gross margin. A proper analysis models these trade-offs before you sign a contract.
Similarly, when evaluating a product mix change or market expansion, you cannot rely on revenue projections alone. You need to know the contribution margin of each unit. This is also vital for initiatives like Tariff Impact Financial Planning or Rule of 40 Valuation Planning, where understanding your exact margin structure dictates your strategic options.
The Four Core Dimensions of Profitability Analysis
To get a complete picture of your business, you cannot look at profitability in a vacuum. We use a four-dimension framework that balances growth, profitability, safety, and efficiency.
One of the most critical aspects of this framework is integrating cash flow analysis. A company can be highly profitable on paper while sliding toward insolvency due to poor cash collection or heavy inventory builds. Systemic shocks, like supply chain disruptions or sudden economic downturns, can quickly turn paper profits into cash crises. This is why safety and efficiency metrics must be analyzed alongside profitability to manage Operational Risks
Let us break down how we slice profitability across different dimensions of the business using modern Business Performance Metrics.
Product and Customer Profitability Analysis
Not all revenue is created equal. A customer who generates $1M in revenue but demands constant custom engineering, heavy customer support, and expedited shipping might actually be unprofitable.
To solve this, we use activity-based costing (ABC) to calculate the true cost-to-serve. Instead of spreading overhead evenly across all products, ABC allocates indirect costs based on actual resource consumption. For example, if your customer support team spends 80% of their time on one specific product line, that product line should bear 80% of the support overhead.
By calculating customer lifetime value (CLV) and subtracting the true cost-to-serve, you can group your customers into cohorts. This reveals your most valuable accounts and helps you decide whether to renegotiate terms with low-margin clients or transition them out.
Sales Channel and Market Profitability Analysis
Different distribution channels and geographic markets carry unique transaction costs. Selling directly to consumers online might offer high gross margins but come with massive customer acquisition costs. Selling through wholesale distributors might offer lower gross margins but require very little marketing spend.
Slicing your profitability by sales channel and geographic region helps you understand where your marketing and sales dollars are most effective. It also highlights how volume metrics and pricing changes impact your bottom line in different territories.
Margin Ratios vs. Return Ratios: A Comparative Framework
To evaluate your business, you need to understand the difference between margin ratios and return ratios. Margin ratios tell you how much of each dollar of revenue is kept as profit at various stages of your P&L. Return ratios tell you how efficiently you are using capital to generate those profits.
Here is how they compare:
| Ratio Category | Key Metrics | What It Measures | Best Used For |
|---|---|---|---|
| Margin Ratios | Gross Margin, Operating Margin, Net Margin | Percentage of revenue retained after specific expenses | Evaluating pricing power, production efficiency, and overhead control |
| Return Ratios | Return on Capital Employed, Return on Net Operating Assets, Return on Invested Capital, Return on Operating Assets | Profit generated per dollar of capital or assets invested | Evaluating capital allocation, asset utilization, and investment efficiency |
Let us look closer at the return ratios:
- ROCE (Return on Capital Employed): Measures profit relative to total capital (debt plus equity). It is great for comparing capital-intensive businesses.
- RNOA (Return on Net Operating Assets): Compares operating income to net operating assets (operating assets minus operating liabilities). It isolates the profitability of core operations from financing decisions.
- ROIC (Return on Invested Capital): Similar to RNOA, this measures the return generated on all capital invested in the business, including debt and equity.
- ROOA (Return on Operating Assets): Measures operating profit relative to gross operating assets, ignoring how those assets are funded.
To learn more about tracking these metrics dynamically, check out our guide on how to Increase Business Value with Smarter Financial Reporting.
Decomposing Operating Profitability and the Operations Funding Ratio
To truly understand your operating profitability, we look to advanced corporate finance. A groundbreaking Academic Study on Operating Profitability Drivers introduces a powerful three-driver decomposition of RNOA:
$$\text{RNOA} = \frac{\text{Operating Profit Margin} \times \text{Operating Asset Turnover}}{\text{Operations Funding Ratio}}$$
Where:
- Operating Profit Margin is operating profit divided by sales.
- Operating Asset Turnover is sales divided by operating assets.
- Operations Funding Ratio (OFR) is net operating assets divided by operating assets.
This formula highlights a critical, often ignored driver: how much of your operating assets are funded by operating credit (like accounts payable and accrued liabilities) rather than costly capital (debt and equity).
For the average firm, net capital funds 64.1% of operating assets, with operating liabilities funding the rest (meaning the median Operations Funding Ratio is 67.3%).
The study shows that increasing your Operations Funding Ratio by one standard deviation from its mean would reduce RNOA by 2.1 percentage points, from 7.7% to 5.6%. Why? Because you are relying more on expensive capital to fund your assets rather than interest-free operating credit.
Evaluating these three drivers together prevents common analytical errors. For example, turnover should be measured relative to operating assets rather than net operating assets because sales are generated by operating assets, regardless of how they are funded.
Step-by-Step Checklist to Conduct a Comprehensive Analysis

To execute a professional-grade profitability analysis, follow this structured checklist:
1. Gather and Reformulate Financial Statements
Do not just pull your standard GAAP reports. Reformulate your balance sheet and income statement to clearly separate operating activities from financing activities. This ensures you are measuring the business's core earning power, not its capital structure decisions.
2. Distinguish Between Recurring and Transitory Income
Strip out one-off gains or losses, such as a legal settlement, a restructuring charge, or a gain on an asset sale.
The data proves this is vital: the standard deviation of Recurring ROE is 23.3% compared to 25.6% for standard ROE. This means excluding transitory items reduces the noisy dispersion of profitability across periods, giving you a clearer picture of your actual operating trends.
3. Perform a Break-Even and Margin of Safety Analysis
Separate your costs into fixed and variable. Calculate your break-even point:
$$\text{Break-Even Point (Units)} = \frac{\text{Total Fixed Costs}}{\text{Sales Price per Unit} - \text{Variable Cost per Unit}}$$
Then, calculate your margin of safety to understand how much revenue can drop before the business begins losing money.
4. Segment and Slice the Data
Do not stop at the company-wide level. Slice your margins and return ratios by product line, customer cohort, sales channel, and geographic region. Use activity-based costing to allocate shared overhead.
5. Validate Master Data Quality and Accounting Policies
Ensure your product, customer, and material master data are clean. If your inventory valuation methods (FIFO vs. LIFO) or capitalization policies have changed, normalize these differences before comparing periods.
6. Benchmark Against Peers
Compare your ratios to industry averages. Remember to adjust your expectations based on your business model. An asset-heavy manufacturing business will naturally have lower asset turnover and higher margins, while a distributor will have high turnover and razor-thin margins.
To streamline this entire process, we recommend setting up a dedicated Financial Reporting Dashboard that tracks these metrics automatically.
Overcoming Common Pitfalls and Challenges
Conducting a profitability analysis is not without its hurdles. The most common challenges we see in mid-market companies include:
- Data Accuracy and Master Data Quality: If your ERP systems contain duplicate customer profiles or poorly categorized expenses, your cost allocations will be wrong.
- Resource Constraints: Mid-market finance teams are often buried in day-to-day accounting work, leaving little time for deep analytical modeling.
- Underestimating Financial Leverage: It is easy to confuse high shareholder returns with operational health. For many companies, financial leverage has a massive (positive or negative) impact on shareholder profitability that can mask weak underlying operations.
- Ignoring Seasonal Adjustments: Comparing Q4 to Q3 in a retail or seasonal business will lead to terrible strategic decisions. Always compare seasonal businesses on a year-over-year basis for the same quarter.
For a deeper academic perspective on avoiding these analytical errors, you can review the Columbia University Research on Profitability Analysis. Additionally, our guide on Scenario vs Sensitivity Analysis can help you model how changes in your cost and pricing assumptions will impact your future margins.
Frequently Asked Questions about Profitability Analysis
What is the difference between profit and profitability?
Profit is an absolute dollar amount, calculated as revenue minus expenses. Profitability is a relative efficiency metric, expressed as a ratio or percentage. Profitability tells you how much return or margin you generate relative to your revenue, assets, or equity.
How often should a mid-market business analyze profitability?
You should review your high-level profitability ratios monthly. However, a deep-dive, multi-dimensional profitability analysis that slices by customer, product, and channel should be conducted at least quarterly to catch margin erosion early.
Why is the Operations Funding Ratio important for forecasting?
The Operations Funding Ratio (OFR) is highly stable over time because it is driven by structural balance sheet relationships. Since operating liabilities are strongly tied to operating assets, forecasting the OFR allows you to predict future capital requirements and RNOA with much greater accuracy than traditional forecasting methods.
Aligning Your Operations for Growth

Maximizing the profit potential of your business requires moving past basic Profit and Loss Management. It demands a deep, strategic look at how your assets, capital, and operations work together to generate returns.
At MyExec, we provide the fractional CFO and FP&A services that growing businesses ($5M to $50M in revenue) need to scale successfully. We deliver senior finance leadership, strategic planning, and professional valuations at a fraction of the cost of a full-time hire. Our scalable, full-stack finance support gives you access to everything from analysts to CFOs, rather than tying you to a single-person retainer. Our ultimate goal is to help you grow to the point where a full-time CFO makes sense, and then help you cleanly transition the function.
Ready to turn your profitability analysis into a stronger strategic finance plan? Download MyExec's Strategic Finance Guide for practical next steps, and if you want help applying it to your business, book a call with our team.