
Scenario vs Sensitivity Analysis: When to Use Each
Most finance teams I work with use "scenario analysis" and "sensitivity analysis" interchangeably, as if they were the same thing. They aren't. They answer different questions, help drive different strategic decisions, and failing to utilize them properly, or at all, can cost your company significantly in the long term.
This post is the deep version of what's covered in the 7 Tools to Build a Strategic Finance Function guide. The guide gives you the framework. This post explains how to actually execute each one inside a recurring-revenue business so the analysis earns its place in the conversation.
Here's the short version of what we're going to cover. Scenario analysis answers "what would we do if X happened?" Multiple variables move at once, you get a coherent story about a possible future, and the output is a contingency plan. Sensitivity analysis answers "which variable matters most and by how much?" One variable moves, everything else stays put, and the output is a ranking of where to spend your management attention.
Different jobs. Different math. Different insights and outcomes.
Why the Confusion Costs You
The cost of conflating these two shows up in three places.
The first is the board meeting or monthly executive reviews. A CFO presents a "sensitivity" that has revenue, churn, and gross margin all moving simultaneously. The board sees that EBITDA drops $1.4M and asks what's driving it. Nobody can answer cleanly because three things changed at once. The conversation becomes about the model instead of about the decision.
The second is capital allocation. Without a real sensitivity analysis, leadership has no defensible ranking of where a dollar of effort produces the biggest return. The retention investment loses to the louder pipeline ask, even when the math obviously favors retention. I've watched companies pour six figures into a sales hire when a $40K customer success investment would've paid back four times over in six months.
The third is risk planning. Without proper scenarios, the response to bad news is improvised. The largest customer signals churn, and instead of triggering a pre-built playbook, leadership spends two weeks rebuilding the forecast from scratch. By the time the analysis lands, valuable time that could have been spent taking mitigating actions is now lost and you’re scrambling to catch up.
Scenario Analysis: What It Actually Is
A scenario is a coherent story about a possible future. Multiple assumptions change at the same time because in real life they always do. You don't lose your largest customer in a vacuum. There are usually a few catalysts: quality of service slipping, competitor pricing pressure, broader market softness, internal churn already trending the wrong way. Several things move together because that's the actual mechanism of how a downturn unfolds in a business.
The output of a scenario is the financial picture under that story: revenue, gross margin, operating income, cash position, and any covenant ratios that matter. The point is not to predict which scenario will happen. The point is to know what the range looks like and to have a plan ready for each named outcome.
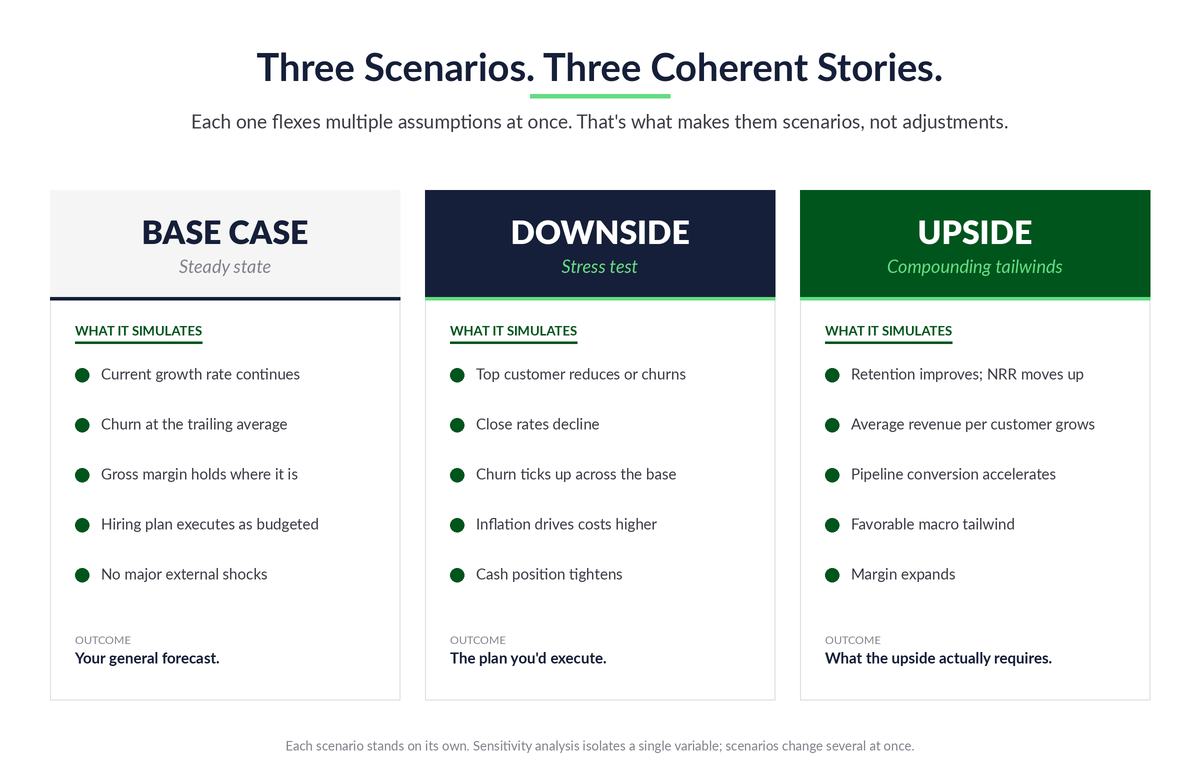
At MyExec, we like to utilize a common structure for the clients we work with.
Base Case: This is the steady state. Current trends continue. Pull the assumptions straight from your rolling forecast: monthly growth rate, churn, gross margin, opex run rate, hiring plan. No drama, no stretch, no hedging. Just a faithful read of where the business is heading if nothing changes. Functionally, this is your general forecast.
Downside: Treat this as a stress test, not a mild adjustment. Simulate what would happen if several factors hit simultaneously and put real downward pressure on the business. Higher inflation driving costs up, the largest customer reducing spend, close rates declining, churn ticking up. Maybe the macro environment turns and you're modeling the impact of a recession on cash flows. The point is to see how the business holds up when multiple things go wrong at once, because that's how downturns actually arrive.
Upside: Run the opposite. Churn improves, average revenue per customer grows, net revenue retention moves up. Maybe favorable macro conditions tail behind what the team is doing internally. Same multi-variable logic, just pointed in the other direction.
The scenario table from the 7 Tools guide (below) is the format that works. Three columns, one per scenario. Key assumptions at the top, six-month financial outcomes below. The downside in that example shows operating margin collapsing from 21.5% to 7.3% and cash dropping to $265K. The upside shows operating margin expanding to 24.3% and cash building to $870K. That spread, $854K of operating income and $605K of cash over six months, is the actual answer to "how much cushion do we need and how aggressively can we invest?"
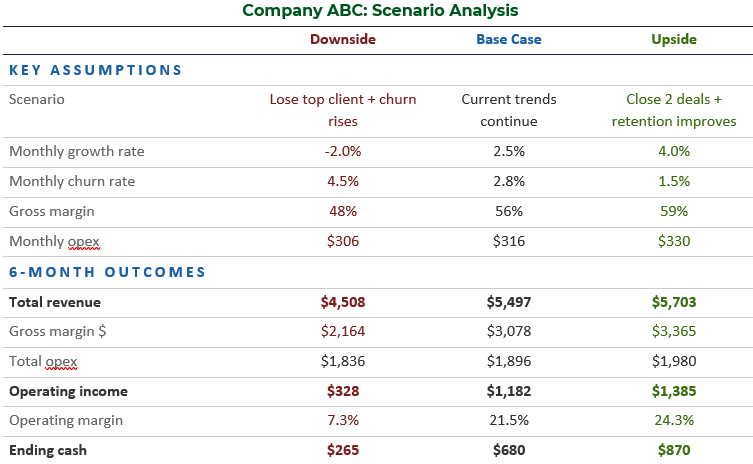
That's the question scenarios answer. Not "what will happen?" but "what's the range, and what's our plan for each end of it?"
Stress the Liquidity, Not Just the P&L
When you're building the downside, the real exercise is stressing the liquidity of the business, not just compressing the operating margin. Work with something like a 25% revenue impairment as a starting point. What happens to cash? What would you need to do to keep the company cash flow positive? Even if it's a low-probability event, running the math forces a different kind of thinking.
Based on our experience, the most powerful version of this exercise is one that impairs both revenue and gross margin at the same time. The assumption in this scenario is that the customers who leave under stress, or the service lines that contract first, are higher-margin ones. So when revenue drops 25%, gross margin doesn't hold at the base case rate. It compresses with it. That double hit is what puts real pressure on operating income and cash flow as you model the next twelve months out.
You walk out of that exercise with a list of actions: which costs you'd cut and in what order, which collections you'd accelerate, which discretionary spend you'd freeze, is the current line of credit sufficient, how you’d communicate this throughout the organization. So when something close to that scenario actually shows up, the response is already mapped out. You're not burning cash while leadership debates the response. You're executing a plan you built when you had time to think clearly.
The compounded pressure from impairing both revenue and margin forces the conversation nobody wants to have when things are good: which operating expenses are actually critical to keeping the business running, and which ones are nice-to-haves. Which hires get paused. Which programs get cut. Which contracts get renegotiated. You want those answers in hand before you need them.
The other discipline here is to treat the scenario as a planning tool rather than a prediction. The downside isn't what's about to happen. It's what you'd do if it did.
It can feel extreme. It usually is. That's the point. Nobody ever expects a crisis, and that's exactly why so many businesses fail when one arrives. The ones that survive are the ones whose finance function did the uncomfortable work when there was still time to think clearly.
Sensitivity Analysis: What It Actually Is
Sensitivity analysis differs from scenario analysis in a specific way. You hold everything constant and flex one variable. The point is to isolate the impact of that single input so you can rank which variables matter most.
The discipline is in what you don't change. Pick a variable, say monthly churn rate. Move it in defined increments, say half a point at a time. Recalculate revenue, gross margin, and EBITDA at each step. Everything else, customer count, ARPU, gross margin percentage, opex, all of it, stays exactly where the base case had it. The result is a clean reading of how much that one input matters.
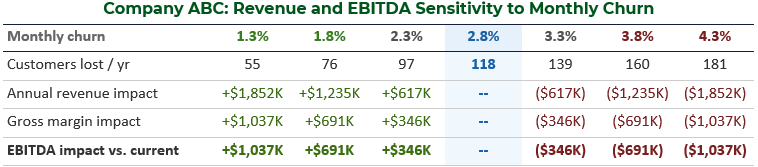
Here's the example from the 7 Tools guide that makes the point cleanly. Take a recurring-revenue business with 350 customers, $2,450 monthly ARPU, 56% gross margin, and 2.8% monthly churn. Flex monthly churn in half-point increments, holding everything else constant.
Now do the same exercise for pipeline close rate. Same business, 200 sales opportunities per year, base case 24% close rate. Flex one point at a time.
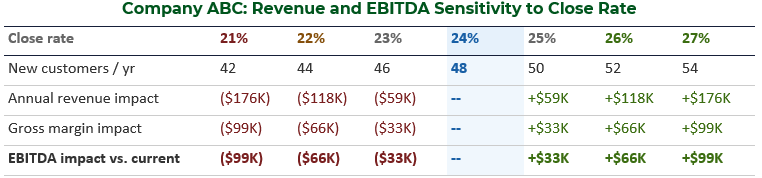
Here's the strategic insight that emerges, and it's the kind of insight that only sensitivity analysis surfaces cleanly. A half-point improvement in monthly churn moves EBITDA by $346K. A full point of close-rate improvement moves it by $33K. Per unit of effort (one-point increment), retention is roughly twenty times more valuable than acquisition.
That's fundamentally tied to the structure of the business model. Churn acts on your entire customer base every month. Close rate acts only on incoming opportunities. Those two mechanisms produce dramatically different EBITDA impact per unit of effort, and unless you've actually run the math, you don't know it.
The leadership conversation that comes out of this is completely different from a scenario conversation. It's not "what do we do if?" It's a capital allocation question. If we have $100K of investable capital this quarter, where does it go and how much to each initiative? Sensitivity analysis is what makes that conversation defensible, because it ranks the inputs by financial impact and forces the discussion onto the variables that actually move the business.
The Inputs That Matter Are Specific to Your Model
Which variables your business is most sensitive to depends entirely on how the model is structured. The general categories are somewhat predictable (churn, ARPU, close rate, gross margin, customer acquisition cost), but the relative weighting is not. For example, a business may be significantly more sensitive to a 1% improvement in net revenue retention than a 1% increase in average revenue per new client. If that's true for your business, the implication is clear: focus the next investment on increasing NRR rather than pushing harder on per-deal revenue at the new-logo end.
Churn is almost always a major factor. Beyond that, the answer depends on your specific unit economics. Which means the prerequisite to running this analysis cleanly is having those unit economics defined in the first place: knowing the KPIs that actually drive the business model, with formulas that hold up to inspection. Without that foundation, the sensitivity analysis is grounded in hypotheticals, not reality.
Stay Within the Realm of Possibility
The other discipline is keeping the inputs grounded. It's easy to write a sensitivity that says "if we reduce churn from 3% monthly to 1% monthly, we save $X." Mathematically true. Operationally, is 1% actually attainable for this business given its customer base, contract structure, and service model? If not, the analysis is misleading. It points at an impact that can't be captured.
The constraints and the actual operating limits matter as much as the math. Otherwise you'll allocate capital to a lever you can't actually pull, and the return that looked good on paper never materializes.
Where Sensitivity Analysis Goes Wrong
Two primary points of failure exist with sensitivity analysis.
The first is changing more than one variable. The moment you flex churn and gross margin together, you've stopped doing sensitivity analysis. You're running a mini-scenario. The output may be interesting, but you've lost the ability to say which variable drove the result. If both inputs moved and EBITDA dropped $500K, was it $400K from churn and $100K from margin? Or vice versa? You can't tell. The whole point of the exercise is the attribution, and you've thrown it away.
The second is picking variables nobody can actually move. Sensitivity to interest rates is fine if you're a bank. For a $30M SaaS company, sensitivity to "macro GDP growth" is academic. Pick variables your team can actually influence. The output should map to decisions someone in the room could make next quarter.
How They Work Together
Scenarios and sensitivities aren't competitors. They're complements that help to create an informed set of strategic priorities both today and under multiple potential futures.
Sensitivities tell you which variables matter most. Once you know retention is 20x the lever new logos are, you know where to invest. That's a capital allocation answer.
Scenarios tell you what playbook to have ready. Once you've modeled losing your top three customers, you know what cost actions to take, what cash actions to take, and how to communicate the plan of actions throughout the organization. That's a contingency answer.
Run them on the same model and they reinforce each other. The downside scenario assumes churn rises to 4.3%. The churn sensitivity tells you that move costs $1,037K of annual EBITDA. The scenario shows the consequence. The sensitivity shows the size of the lever. Together they tell leadership: this is what bad looks like, and here's the single biggest input we have to move it.
Because of how they complement one another, they should be presented to leadership sequentially while distinguishing between the insights derived from each separately. Scenarios first, with a clear narrative and rationale for each. Sensitivities next, ranking the top three to five variables by EBITDA impact. They reinforce each other, but they answer different questions, and presenting them as the same exercise blurs that distinction.
Building Both on the Rolling Forecast
The implementation move that makes both tools sustainable is to build them on top of the rolling forecast, not as separate models.
This is where most lower-middle-market companies make a mess. The forecast lives in one spreadsheet. The "scenarios" live in a different spreadsheet, with different assumptions and different structure. The sensitivity work is a third spreadsheet entirely. The result is disjointed views of the business that don't reconcile, and leadership ends up looking at three different versions of the same company.
What you actually want is a cohesive story built on one version of the truth.
The fix is structural. If you already have a rolling forecast with the assumptions defined: revenue growth, churn, gross margin, headcount, and whatever drivers matter most for your model, layer the scenarios on top of that as alternate assumption sets that flow through the same model. Layer the sensitivities as a separate tab that pulls from the same base case.
When the rolling forecast updates, both update with it. The scenarios and sensitivities don't drive the business's success on their own. The decisions they inform do, and those decisions are only as good as the underlying numbers tying together.
We had a client recently work through this exercise and arrive at the same insight the math above shows: churn reduction was worth significantly more to the business than cross-selling existing clients or even adding new ones. The interesting part is what they did with that. The action wasn't to abandon cross-sell. When you cross-sell or upsell an existing client, you create a deeper relationship and that itself reduces churn. So cross-sell stayed in the program, but it was reframed as one mechanism in a broader retention motion. The bigger work was understanding why customers were leaving, identifying the root causes of exits (which interestingly, ended up being unanticipated financial crises), and building programs that addressed the largest drivers directly.
The 7 Tools guide walks through the monthly operating rhythm that keeps this connected. That cadence is what makes the difference between analysis that's current and ready when leadership needs it, and analysis that gets rebuilt from scratch every time someone asks a question.
When to Run Each
A practical rule that's worked with our clients is to run sensitivities when leadership is making a resource allocation decision with multiple alternatives. Hiring plan, sales investment, customer success build-out, pricing change. The question is "where should the next dollar go?" Sensitivity analysis is the answer.
Run scenarios when leadership is making a risk decision. New market entry, large customer concentration, debt covenant compliance, capital raise sizing. The question is "what's the range of what could happen and what's our plan for each end?" Scenario analysis is the answer.
If these are built into the rolling forecast, they’ll update monthly with the forecast. In other instances, they can be updated quarterly or every six months, but there should be some regular cadence depending on the business. As often as is necessary to keep the contingency plans relevant and visible.
For lean finance teams, the realistic build is two scenarios (base and downside; the upside is nice-to-have but not essential) and three sensitivities (the variables with the biggest known impact in your business). That's the floor. From there, layer in additional scenarios when specific risks emerge and additional sensitivities when leadership starts asking new questions or strategic decisions that change the dynamics of the business come into play.
Build These Tools in Your Business Today
Sensitivity analysis is what makes the most significant unit economics and operating levers in your business model visible. Scenario analysis is what makes the response to a sudden change pre-built rather than improvised.
The example math in this post is one specific business with one specific cost structure. Yours will be different. The whole point of doing the work is figuring out where your model is most sensitive and what your real range of outcomes looks like, not adopting someone else's conclusion.
If your finance function isn't producing both on a regular cadence, you're operating without two of the most powerful tools available to a recurring-revenue business. And it's not because they're hard or expensive. It's because nobody's been disciplined about building them and using them.
If you want a starting point on the broader strategic finance build-out, the strategic finance assessment is a great place to begin.