
How to Model Tariff Risk in Your 2026 Forecast
The average effective U.S. tariff rate sits near 14% as of early 2026, up from roughly 2.5% before the current wave of trade policy changes. For any middle market company with import exposure, that is not a rounding error. It is a margin event.
Yet most finance teams still handle tariffs the same way they handle freight surcharges: a flat percentage tacked onto COGS, updated whenever someone remembers to update it. That approach worked when the rate was 2.5% and stable. It does not work when the rate can move several points in a single policy announcement.
This post walks through a practical framework for building tariff scenarios into a rolling forecast. No complex trade-policy analysis required. Just three scenarios, a handful of inputs, and a gross margin stress test you can run in an afternoon.
Why a Flat Tariff Assumption Fails
The problem with a single-point tariff estimate is that it assumes stability in a system designed to be unstable. Since 2022, the effective U.S. tariff rate has moved from 1.5% to over 10% to nearly 16% (before a Supreme Court ruling adjusted it) and back to roughly 14%. Rates vary dramatically by trading partner: China faces an effective rate above 30%, while most European imports sit near 15%. And these numbers shift quarterly, sometimes monthly, depending on trade negotiations and policy announcements.
A flat COGS adjustment cannot capture that volatility. When your forecast assumes a single tariff rate and the actual rate moves two or three points, the impact flows straight through gross margin.
Run the math on a $30M revenue company with 55% gross margins and 40% of COGS tied to imported inputs. That is $13.5M in total COGS, $5.4M of it exposed to tariff changes. A 3-point tariff increase on that $5.4M adds roughly $160K in annual cost, dropping gross margin from 55.0% to 54.5%.
Scale that to a company with heavier import exposure or a wider rate swing, and the numbers get uncomfortable fast. The fix is not to predict the exact tariff rate, but to model a range of outcomes and know your margin sensitivity before the rate changes.
The Three-Scenario Framework
Build three tariff scenarios into your forecast. Each one adjusts a single variable: the effective tariff rate applied to your import-exposed COGS.
Scenario 1: Current State: Use today's effective rate on your actual import mix. If you import components from China, Southeast Asia, and Europe, weight the rate by spend. Do not use the headline national average.
A company sourcing 60% from China and 40% from Europe faces a blended rate very different from the 14% average. Calculate your company-specific blended rate based on country-of-origin data from your purchasing or AP system.
Scenario 2: Escalation: Model a 5-to-8 point increase on your highest-exposure trade corridor. This is not a worst case. It is what happened between January and March 2025 on Chinese imports alone. If your primary exposure is China, model the blended rate with China at 40%+. If your exposure is broader, model a 3-to-5 point across-the-board increase.
Scenario 3: Partial Relief: Model a 3-to-5 point reduction from current levels, reflecting a potential trade agreement, exemption, or policy reversal. This is not optimism. The Section 122 tariffs are scheduled to expire, and relief on specific product categories has happened before. Knowing what margin recovery looks like under relief helps you make faster capital allocation decisions if and when it happens.
For each scenario, flow the adjusted tariff rate through to COGS, gross margin, operating income, and cash flow. The math is straightforward: take your import-exposed COGS line, multiply by the scenario tariff rate, and replace the current assumption.
Connect Tariff Scenarios to Gross Margin
The output you care about is gross margin sensitivity. Build a simple table showing each scenario's gross margin percentage, gross profit dollars, and variance from your base case. Using the same $30M company from earlier ($13.5M COGS, $5.4M import-exposed), the table looks like this:
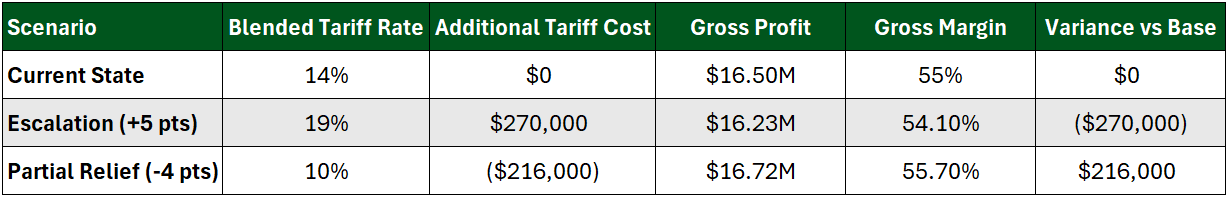
That is a $486K spread between the best and worst cases on a single cost variable. It takes fifteen minutes to build once the scenarios are set up, and it gives your board a one-page view of tariff exposure they can read in sixty seconds.
Two questions matter most.
First, at what tariff rate does gross margin cross below your minimum threshold? Every business has a floor, whether it is a board target, a covenant, or the point where unit economics stop working. Find the rate that breaks it.
Second, how much pricing power do you need to offset each scenario? If Scenario 2 compresses gross margin by 200 basis points, and you can realistically raise prices 1.5% without losing volume, you know you are 50 basis points short. That gap tells you exactly how much cost reduction, supplier renegotiation, or margin compression you need to plan for.
The FP&A Assessment can help identify whether your current forecasting process captures this kind of sensitivity analysis or relies on static assumptions.
Just as tariff risk requires scenario-level modeling, M&A readiness demands the same discipline applied to the entire financial model.
Integrating Tariffs into a Rolling Forecast
Static annual budgets are the worst place to handle tariff risk because the rate can change faster than your budget cycle. A rolling forecast, updated monthly or quarterly, gives you a structure to refresh tariff assumptions with current data.
Here is how to make it operational.
Start by tagging your import-exposed COGS. Work with procurement or AP to identify every cost line with direct or indirect import exposure. "Indirect" matters here: your domestic supplier's costs may include imported raw materials, and those tariff increases get passed through to you. Most middle market companies can complete this exercise in a few hours, and it almost always reveals exposure they did not know they had.
Next, assign a tariff rate by trade corridor. Group your import-exposed spend by country of origin, apply the current effective rate, and update these rates whenever a policy change takes effect. The Tax Foundation and Penn Wharton Budget Model both publish current effective rates by country that you can use as inputs.
Then run all three scenarios each forecast cycle. Do not just update the base case. Refresh all three scenarios so your leadership team always sees the range. When the board asks "what happens if tariffs go up again," you have the answer ready, not a promise to model it next week.
This is one of the areas where a strong FP&A Operating Model pays for itself. The companies that respond fastest to tariff changes are the ones that already have the scenario infrastructure built.
What to Do With the Output
A tariff scenario model is only useful if it drives decisions. Three actions to take once you have the numbers:
Set pricing triggers. Define the tariff rate threshold at which you initiate a price increase. Do not wait for margin compression to show up in actuals. If your Scenario 2 shows gross margin dropping below 50%, and your current blended rate is two points away from that trigger, start the pricing conversation now.
Renegotiate with data. When you approach suppliers about cost sharing, showing them your three-scenario model (with their products highlighted) is more effective than a general request to "sharpen the pencil." Specific numbers create specific conversations.
Pre-approve contingency spend. If Scenario 2 requires shifting a portion of procurement to a domestic or lower-tariff supplier, get the capital approved now. The companies that moved fastest during the 2025 tariff escalation were the ones that had already identified alternative suppliers and pre-approved the switching costs.
The Bottom Line
Tariffs are no longer a temporary disruption. The Richmond Fed/Duke CFO Survey shows that CFOs expect tariff-driven price pressures to persist through 2026 and beyond. Without tariff impact, price growth at the median firm would be roughly 25% lower this year. That gap between "with tariffs" and "without tariffs" is not closing.
Middle market companies that treat tariff risk as a permanent variable in their forecast, not a one-time adjustment, will protect margins and make faster decisions when the next rate change hits. Build the three scenarios. Run the stress test. Know your numbers before the policy announcement, not after.
Most finance teams don't know their tariff exposure until the rate changes. We help middle market companies build the scenario models and rolling forecasts that turn policy surprises into planning exercises. If your forecast still runs on a single tariff assumption, let's fix that.