A Guide to Red Flags in Financial Statements When Buying a Business
Why Is Financial Due Diligence Critical When Buying a Business?

Buying an established business is the largest single capital decision most operators ever make. It is larger than buying a home, funding college, or often every prior investment combined. Knowing what to look for in financial statements when buying a business is what separates a sound acquisition from an expensive lesson. The seller's financial statements have to be read strictly as evidence, not as a sales brochure. Sellers naturally want to present the business in the best possible light, but as a buyer you need the ground truth.
For U.S. businesses in the $5M to $50M revenue range, the stakes are exceptionally high. This is the lower middle market, where founder-led finance is often messy and accounting practices are designed for tax minimization rather than investor transparency. If you rely on a surface-level review of the books, you risk inheriting hidden liabilities, declining margins, or a business model that is structurally fragile.
Signing a Letter of Intent (LOI) strips you of significant negotiating leverage. Once the LOI is signed, you enter an exclusivity period. Your ability to walk away or reprice the deal becomes harder, and the seller knows you have already sunk time and money into the transaction. This makes early due diligence during the courtship phase vital. You must identify structural deal-killers before you bind yourself to exclusivity.
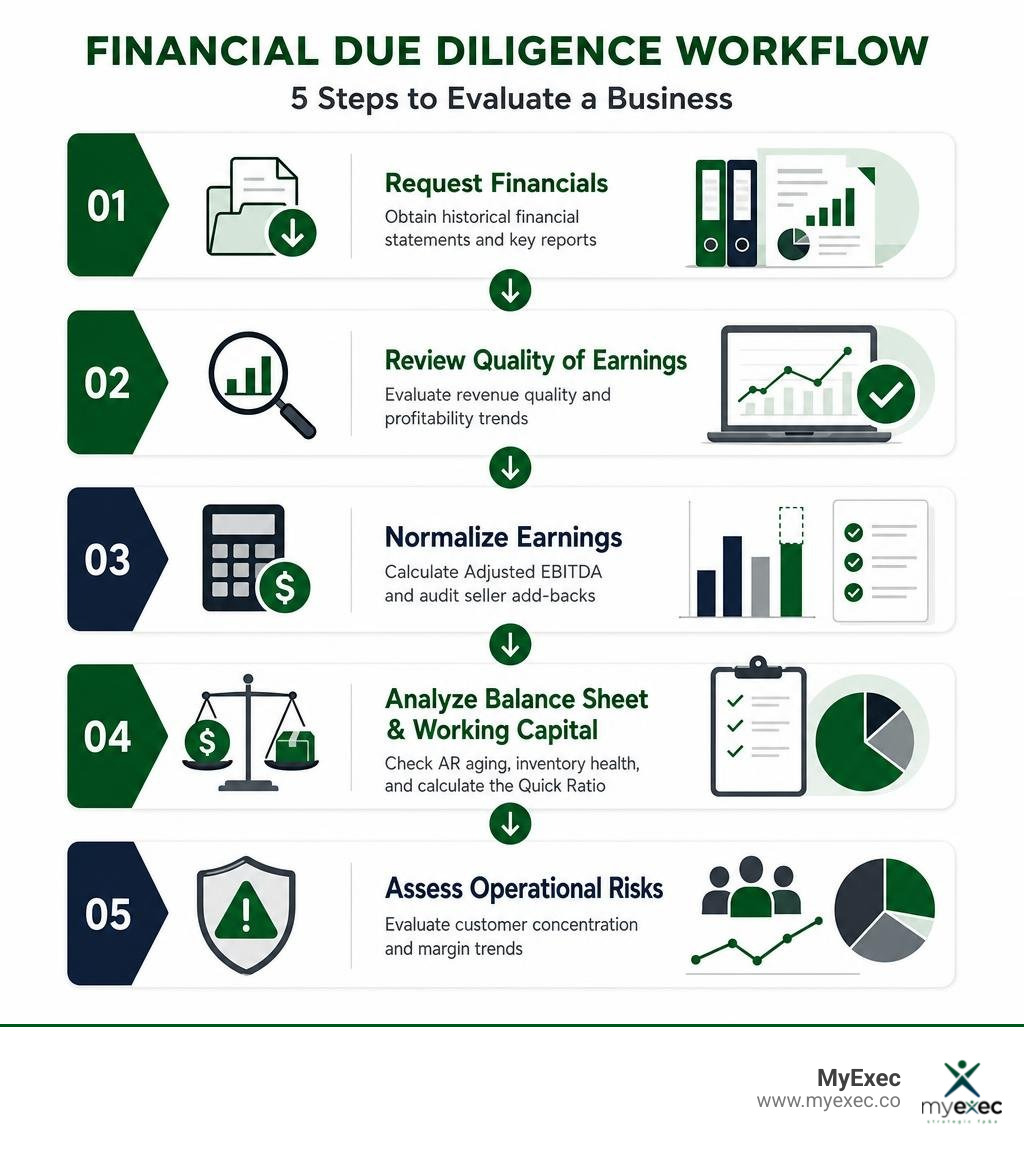
Our team at MyExec has worked across companies from a few million in revenue to roughly $2B, including closely held, private equity owned, and publicly traded companies. We know that the difference between a successful acquisition and a costly mistake comes down to rigorous financial analysis. Let's break down the exact steps you need to take to protect your capital.
What Do the Three Core Financial Statements Reveal About a Target Company's Health?
To truly understand a business, you must analyze the triad of financial statements: the Income Statement (P&L), the Balance Sheet, and the Cash Flow Statement. Analyzing them side-by-side is the only way to spot discrepancies. A business might show soaring net income on the P&L, but the cash flow statement might reveal that cash is actually shrinking because it is tied up in unpaid accounts receivable.
Looking at a minimum of three to five years of historical data is essential to establish trends. A single year is just a snapshot, two years is a comparison, but three to five years reveals a trend. This historical view helps you understand how the business performs across different economic cycles and whether its current performance is sustainable. For a deeper look at managing these statements post-acquisition, see our guide on profit and loss management and how to track them using a financial reporting dashboard.
The Income Statement (P&L)
The Income Statement shows the company's revenue, cost of goods sold (COGS), operating expenses, and net income over a specific period. When evaluating an acquisition, the most recent P&L must be no older than 90 days to ensure you are reviewing recent financial history. Ideally the target has a serviceable accounting function in place and can produce an income statement from the most recent month. If they can't, that can be a sign of poor financial management and requires a closer review of financials.
Gross profit margins are the first thing you should calculate. They show the structural viability of the business model. If gross margins are falling over a 36-month period, it is a major warning sign. It means the business is either losing pricing power or facing rising input costs that it cannot pass on to customers. A business with declining gross margins is often far more fragile than its headline profit suggests.
If gross profit margins are well below industry benchmarks, that can present an opportunity if your team has the skillset to improve those gross margins. It's very important to understand the root cause of sub-optimal gross margins to ensure a strategic fix is viable and can be implemented prior to validating this as an opportunity for value creation.
The Balance Sheet
While the P&L represents a period of time, the Balance Sheet is a snapshot of a specific date. It shows what the business owns (assets), what it owes (liabilities), and the owner's equity. The balance sheet equation dictates that assets must always equal liabilities plus equity.
The balance sheet is where hidden liabilities and bad assets hide. It reveals the company's underlying financial strength and debt obligations. You can see if the company has a healthy cushion of liquid assets or if it is highly leveraged with short-term debt that could choke operations.
A deeper balance sheet review should also compare the company's working capital position against what is normal for its industry and operating model. Calculate current ratio, quick ratio, accounts receivable turnover, inventory turnover, and days payable outstanding to understand whether the business has enough cash, receivables, and inventory to support day-one operations. If working capital is too low, you may need to negotiate a working capital peg or reduce the purchase price. If it is inefficiently high, that may signal improvement potential through faster collections, better inventory management, or more disciplined vendor terms.
The Cash Flow Statement
The Cash Flow Statement tracks actual cash movements across operating, investing, and financing activities. It is the most reliable document in the financial package because it tracks actual cash movements rather than non-cash accrual adjustments. Accrual accounting can easily be modified using accounting entries, but cash is hard to fake.
To find the true economic health of the business, you must calculate free cash flow by subtracting capital expenditures (CapEx) from operating cash flow. This shows the company's ability to fund future growth, service debt, or distribute profits to you without relying on external financing.
You should also study how much of the company's earnings current leadership reinvests back into the business and what return that reinvestment is producing. Review spending on equipment, technology, hiring, marketing, and expansion projects to see whether those investments are creating measurable revenue growth, margin improvement, or operating leverage. A business that reinvests heavily without clear returns may need tighter capital allocation, while a business that underinvests may have untapped upside if you can deploy capital more effectively after close.
How Can You Verify That the Seller's Reported Revenue and Profit Are Accurate?
You cannot take the seller's financial statements at face value. Private companies often minimize taxable income to reduce tax liability, meaning their internal books might look very different from what they report to the government. Comparing internal books to external, third-party records is the best way to catch financial misrepresentations. For businesses in the $5M to $50M range, we highly recommend looking for audited financial statements or performing a detailed Quality of Earnings (QofE) review.
Reconciling with Tax Returns and Bank Statements
The single most important cross-check is comparing the company's internal P&L directly to its tax returns. You should request at least three consecutive years of certified federal tax returns (Form 1120 for corporations or Form 1065 for partnerships). If the internal P&L shows a significantly higher net income than the tax returns without clear, documented adjustments, that is a massive red flag.
Next, cross-reference the P&L and balance sheets with raw bank statements. Look at actual monthly bank deposits to verify that the reported revenue matches the cash hitting the bank. If you are looking at a retail, hospitality, or service business with cash transactions, verify those cash sales against bank deposits and point-of-sale reports. Additionally, check state sales tax returns to confirm reported transaction volumes and ensure the business does not have undisclosed sales tax liabilities.
Spotting Common Accounting Manipulations
Sellers sometimes use creative accounting to make the business look more attractive in the years leading up to a sale. Here are three common manipulations to watch out for:
- Revenue Acceleration: This involves recognizing revenue upfront for long-term contracts right before the sale date. This temporarily spikes revenue but leaves you, the buyer, with the future operational costs of fulfilling those contracts without the corresponding cash.
- Expense Deferral: Sellers might disguise operating expenses as capital expenditures or delay standard equipment maintenance to artificially boost net income. Look closely at maintenance logs and capital expenditure trends over the last three years.
- Unreported Cash Claims: If a seller claims they make a lot of cash under the table that is not reported on federal tax returns, treat that cash as having a value of zero. You should never pay a valuation multiple for unverified, unreported income.
What Is the Difference Between Net Profit and Adjusted Profit?
When buying a business, you will often hear terms like Seller's Discretionary Earnings (SDE) and Adjusted EBITDA. Understanding the difference between net profit and these adjusted metrics is critical for accurate certified business valuations.
SDE represents the total economic benefit available to a single full-time owner-operator, assuming they work in the business. It adds back the owner's salary, personal benefits, and personal expenses run through the business. Adjusted EBITDA (Earnings Before Interest, Taxes, Depreciation, and Amortization) is used for larger, mid-market acquisitions ($5M to $50M revenue) and by institutional lenders. It measures the operating profitability of the business enterprise under professional management, assuming a market-rate salary for a general manager or CEO.
The Danger of Aggressive Seller Add-Backs
The process of calculating adjusted profit is called recasting. Sellers and brokers often present aggressive add-backs to inflate the adjusted profit, which directly increases the asking price.
Valid add-backs include owner salary normalization (replacing the owner's above-market salary with a market-rate replacement), personal auto leases run through the business, and one-time, non-recurring legal fees.
Red flag add-backs include normal marketing spend, routine repairs, and necessary staff salaries that the seller claims are redundant. If the adjusted profit is more than 20% to 30% higher than the reported net profit, it requires very strong justification and deep auditing.
| Metric | Net Income | Seller's Discretionary Earnings (SDE) | Adjusted EBITDA |
|---|---|---|---|
| Primary Use Case | Tax reporting and standard GAAP accounting | Owner-operated small businesses (under $2M in earnings) | Mid-market acquisitions ($5M-$50M revenue) and institutional lenders |
| What It Measures | Bottom-line accounting profit after all expenses, taxes, and depreciation | Total financial benefit available to a single full-time owner-operator | Operating profitability of the business enterprise under professional management |
| Key Adjustments Included | None (standard accounting) | Adds back owner salary, personal benefits, non-cash expenses, and one-time costs | Adds back interest, taxes, depreciation, amortization, and normalized management salaries |
What Balance Sheet Red Flags Should Make You Reconsider a Purchase?
The balance sheet is where historical financial mismanagement and hidden liabilities are recorded. When performing due diligence, you must calculate net working capital (current assets minus current liabilities) to ensure the business has enough runway to operate on day one. You can read more about tracking these metrics in our guide to building a ratio analysis report.
Accounts Receivable and Inventory Risks
Aged accounts receivable reports are critical for evaluating the likelihood of collecting on outstanding invoices. If a significant portion of accounts receivable is older than 60 or 90 days, those debts are increasingly unlikely to be collected. An accounts receivable turnover above 8 times per year shows efficient collection of credit sales. If it is lower, the business is struggling to collect cash from its customers.
Inventory is another area where risk hides. Old, obsolete stock can be listed on the balance sheet at historical cost, but it may actually be worthless. You should conduct a physical inventory count on the day before closing. The purchase contract should state that the final price will be adjusted based on the actual wholesale value of saleable inventory on hand.
Liquidity and Debt Service Ratios
To evaluate the short-term financial health of the business, look at the quick ratio. A quick ratio above 1.0 indicates a business has enough liquid assets (cash and accounts receivable) to cover immediate liabilities without being forced to sell inventory. Negative working capital is a major risk that can lead to a sudden cash crunch post-acquisition.
For financing purposes, commercial lenders will look closely at the Debt Service Coverage Ratio (DSCR). This measures the company's ability to cover its debt payments with its operating cash flow. A business with a DSCR below 1.25 is considered high-risk by most commercial lenders, and getting acquisition financing will be difficult.
Why Can a Highly Profitable Business Still Suffer From Cash Flow Problems?
A business can be highly profitable on paper but still suffer from severe cash flow issues that threaten its survival. This is why the cash flow statement is so critical. For a deeper dive into predicting future cash needs, see our guide on forecasting financial statements.
To understand why operational due diligence is just as important as financial statements, you can read Due Diligence for Acquiring a Company: Go Beyond the Balance Sheet.
Working Capital Cycles and Capital Expenditures
Rapidly growing businesses often face severe cash flow problems because of their working capital cycle. If a business has to pay its suppliers in 15 days but its customers take 60 days to pay, every new sale drains cash. The faster the business grows, the more cash is tied up in inventory and accounts receivable, leaving the business unable to cover short-term expenses like payroll.
Additionally, you must distinguish between maintenance CapEx (the cash needed to keep existing equipment running) and growth CapEx (the cash spent on expansion). If a seller has deferred standard equipment maintenance in the years leading up to the sale, they have artificially inflated their historical cash flow. You will be left with broken machinery and a massive capital expenditure bill immediately after taking over.
How Do You Evaluate Customer Concentration and Operating Margins Against Industry Standards?
Benchmarking the target company's performance against industry standards helps you identify structural risks that should either reprice the deal or cause you to walk away. For more on analyzing these margins, see our guide on profitability analysis.
Customer Concentration Risk
Customer concentration is one of the most under-priced risks in acquisitions. If a single customer represents more than 20% of revenue, it is a yellow flag. If they represent more than 35%, it is a structural risk. If that customer departs post-close, the business's value will be severely damaged.
To mitigate this risk, you can structure the deal with earn-outs or seller notes. For example, you can hold back a portion of the purchase price and make its payment contingent on the retention of that key customer over the first 12 to 24 months of your ownership.
Margin and Expense Benchmarking
Analyze gross profit margin trends over a 36-month period as a leading indicator of business health. An operating expense ratio under 65% is a standard benchmark for operational efficiency in many sectors.
However, margins vary wildly by industry. A 10% profit margin may seem low but is standard in industries like home health care. Conversely, software and digital services enjoy gross margins of 70% to 90%, while wholesale distribution typically operates on thin margins of 20% to 35%. Always benchmark the target company against its specific industry peers in the Mid-Atlantic or Northeast regions, or wherever your target is located.
What Key Questions Should You Ask the Seller Before Signing a Letter of Intent?
Because signing an LOI reduces your negotiating leverage, you must ask the right diagnostic questions during the courtship phase. For more on preparing for this stage, see our resources on M&A financial readiness and how to improve financial reporting.
Top Diagnostic Questions for the Seller
- When did you last take two consecutive weeks of vacation? If the owner cannot step away without operations grinding to a halt, the business is highly owner-dependent.
- Who signs off on pricing decisions? If only the owner can approve pricing, you will struggle to maintain margins without them.
- Who do top customers call when things go wrong? If they call the owner personally, those customer relationships may not transfer to you.
- Why did gross margins compress last year? This helps you identify rising input costs or pricing pressure.
How a Fractional CFO Streamlines Buy-Side Due Diligence
Compiled financial statements are a major red flag because the accountant did not test or verify any of the numbers provided by management. Relying on them is highly risky.
Our team at MyExec provides scalable, flexible support to help you navigate this process. We do not lock you into a single-person retainer. Instead, we use a full-stack finance approach. You might need analyst support to clean up messy data, senior CFO leadership to structure the deal and negotiate working capital pegs, or a mix of both depending on the complexity of the transaction. Our goal is to help you perform rigorous due diligence, reconstruct EBITDA, and prepare the business for a clean post-close transition.
Frequently Asked Questions About Financial Due Diligence
How many years of financial statements should I request when buying a business?
You should request at least three to five years of historical financial statements, plus a trailing-twelve-month (TTM) P&L and the past three years of certified federal tax returns. This historical depth is necessary to establish trends and cross-verify internal books against government filings.
What is the difference between an asset purchase and a stock purchase?
In an asset purchase, you buy specific assets and liabilities, and historical tax liabilities generally remain with the seller. In a stock purchase, you buy the legal entity itself and inherit all historical liabilities, including unrecorded tax reassessments, pending lawsuits, and warranty claims. Stock purchases require much more rigorous due diligence.
Should I hire a professional to review the seller's financial statements?
Yes. For acquisitions of businesses with $5M to $50M in revenue, relying on compiled statements or broker-provided recasts is highly risky. Engaging a fractional CFO or transactional accountant to perform a Quality of Earnings (QofE) review is a high-ROI investment that can save you from a catastrophic financial decision.
How Can You Take the Next Step in Your Acquisition Journey?
When buying a business, remember the golden rule of finance: revenue is vanity, profit is sanity, cash is reality. A business can have impressive revenue and paper profits, but if it does not generate real, sustainable cash flow, it is a risky investment.
Navigating the complex financial landscape of mid-market acquisitions requires experienced, professional guidance. At MyExec, we provide the scalable, full-stack finance support you need to evaluate target companies, spot red flags, and structure successful deals. For more tips on maximizing value, read our guide on how to increase business value with smarter financial reporting.
If you are ready to evaluate an acquisition target in Philadelphia, Reading, New York, Pittsburgh, Baltimore, Wilmington, Washington D.C., or Arlington, contact us today to schedule a consultation. Let us help you protect your capital and make your next acquisition a success.