Financial Reporting and Statement Analysis: Beginner Guide
Core Foundations of Financial Reporting and Financial Statement Analysis

Financial reporting doesn't happen in a vacuum. It rests on a standard structure designed to make financial performance comparable across different businesses and time periods. At the center of this foundation is the Financial Accounting Standards Board (FASB) conceptual framework, which defines the principles, qualitative characteristics, and elements used in U.S. GAAP accounting.
The primary users of general-purpose financial reports fall into distinct groups, each with unique information needs:
- Investors: Focus on profitability, return on equity, and value creation to evaluate whether to buy, hold, or sell equity stakes.
- Creditors and Lenders: Prioritize short-term liquidity, long-term solvency, and cash generation to assess debt repayment capacity before extending loans or credit lines.
- Regulators: Require compliance with U.S. GAAP and SEC disclosure requirements to maintain transparent, fair capital markets.
- Management: Uses financial insights to guide capital allocation, manage operational costs, evaluate profit margins, and drive strategic planning.
Adhering to U.S. GAAP ensures that financial statements remain consistent, reliable, and directly comparable. To learn how structured reporting transforms business visibility, review our operational guide on how to Improve Financial Reporting.
Accrual Accounting vs Cash Accounting
Understanding financial reporting and financial statement analysis requires a clear grasp of accrual accounting versus cash accounting.
Cash-basis accounting records revenue when cash is received and expenses when cash is paid out. While simple, cash accounting can create a distorted picture of performance. A company might collect a large customer deposit in January for work performed in June, making January look wildly profitable and June look depressed, even though operational output was reversed.
Accrual accounting fixes this distortion by using two core principles:
- Revenue Recognition: Revenue is recognized when it's earned (goods delivered or services provided), regardless of when cash changes hands.
- Matching Principle: Expenses are matched and recognized in the exact same period as the revenues they helped generate.
As noted in the FASB framework, accrual accounting provides a far superior basis for evaluating past performance and predicting future cash flows than cash receipts and disbursements alone.
The Four Primary Financial Statements
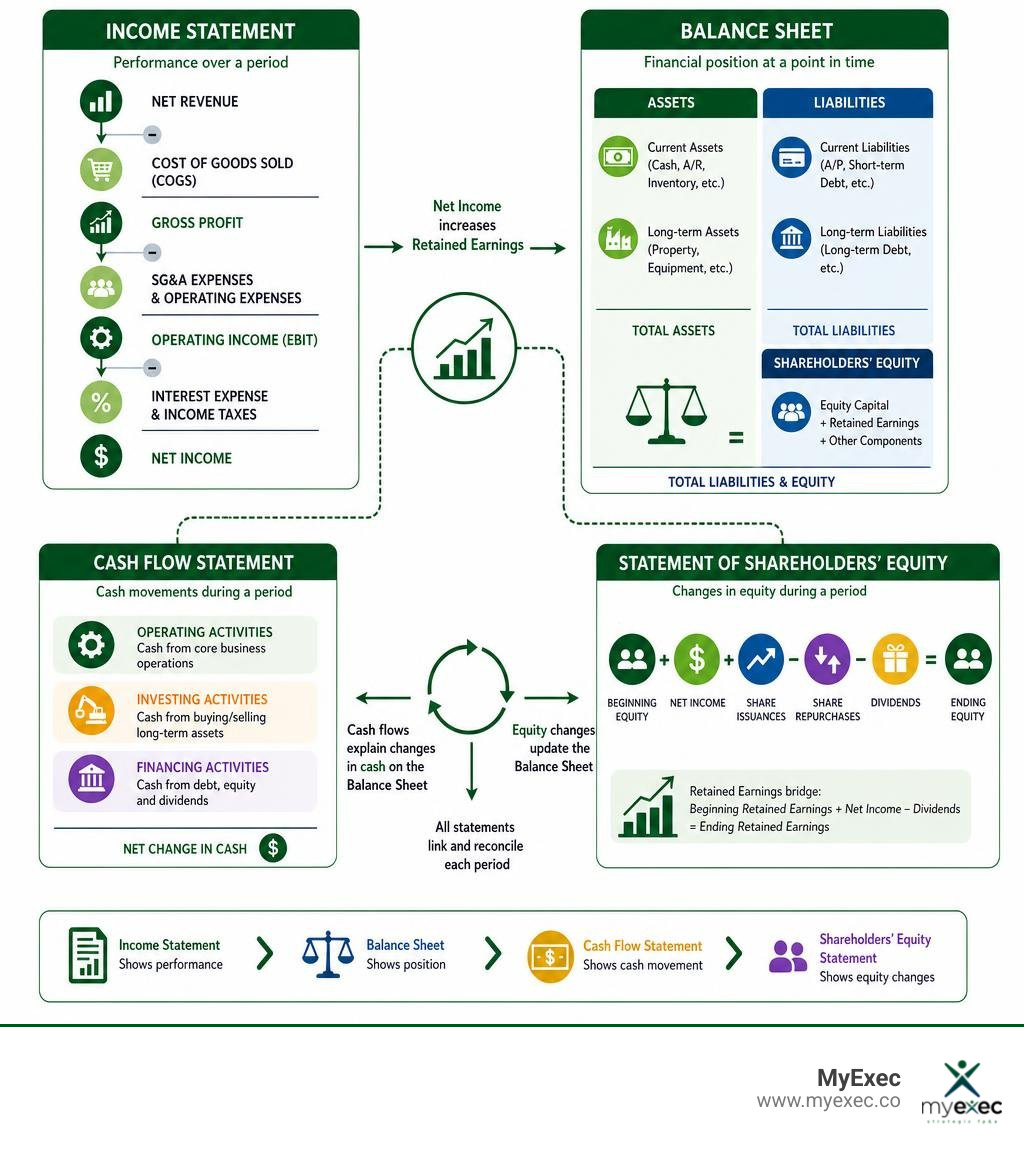
Financial reporting relies on four core statements that work together to reflect a company's financial condition:
- Balance Sheet: A snapshot of assets, liabilities, and equity at a single point in time.
- Income Statement: A summary of revenues, expenses, and profits over a defined period (month, quarter, or year).
- Cash Flow Statement: A record of actual cash movements across operating, investing, and financing activities during a period.
- Statement of Shareholders' Equity: A reconciliation showing how equity changed across the period through net income, owner contributions, dividends, and distributions.
These statements articulate together. The net income from the income statement flows directly into retained earnings on the balance sheet and serves as the starting point for operating cash flow on the cash flow statement. You can see how these linkages function in practice by reading about the P&L Balance Sheet relationship.
The Four Primary Financial Statements Explained
Balance Sheet and Income Statement Dynamics
The balance sheet is governed by the core accounting equation:
$$\text{Assets} = \text{Liabilities} + \text{Shareholders' Equity}$$
Assets represent economic resources owned by the firm (cash, accounts receivable, inventory, equipment). Liabilities represent claims by external creditors (accounts payable, short-term debt, long-term debt). Shareholders' equity represents the residual claim belonging to owners.
Under U.S. GAAP, balance sheet assets are typically recorded at historical cost rather than current market value. While conservative, this approach prevents subjective asset write-ups, though it requires analysts to adjust book values when evaluating real economic worth.
The income statement follows a multi-step format to reveal operational efficiency:
- Gross Profit: Net Revenue minus Cost of Goods Sold (COGS).
- Operating Income (EBIT): Gross Profit minus Selling, General, and Administrative (SG&A) expenses and operating overhead.
- Net Income: Operating Income minus interest expense and income taxes.
Tracking these layers helps pinpoint whether margin changes stem from raw material costs, wage growth, or overhead drift. For more details on managing operating margins, see our resource on Profit and Loss Management.
Cash Flow Statement and Equity Changes
A company can show strong net income on paper while running completely out of cash. The cash flow statement eliminates non-cash accruals to show exact cash movements across three distinct buckets:
- Operating Activities: Cash generated or consumed by core business operations. It adjusts net income for non-cash expenses (like depreciation) and changes in working capital (receivables, inventory, payables).
- Investing Activities: Cash used for capital expenditures (equipment, technology) or earned from asset sales.
- Financing Activities: Cash flows related to capital structure, including debt issuance or repayment, equity raises, and dividend payouts.
Companies can present operating cash flow using either the direct method (listing actual cash receipts and disbursements) or the indirect method (reconciling net income to cash flow). The indirect method is most common because it clearly bridges accounting net profit with operational cash generation.
The statement of shareholders' equity bridges the balance sheet across sequential periods by tracking retained earnings, stock issuances, share repurchases, and distributions.
Management’s Discussion and Analysis (MD&A) Context
Financial statement numbers require context. The Management’s Discussion and Analysis (MD&A) section provides executive narrative detailing operational results, liquidity conditions, known trends, and business risks.
Under the Sarbanes-Oxley Act of 2002, senior corporate officers must personally certify that financial reports fairly present operating results and financial condition in all material respects. This legal framework reinforces data integrity, giving leadership and investors confidence that MD&A commentary reflects actual operations.
Essential Methods for Analyzing Financial Reports
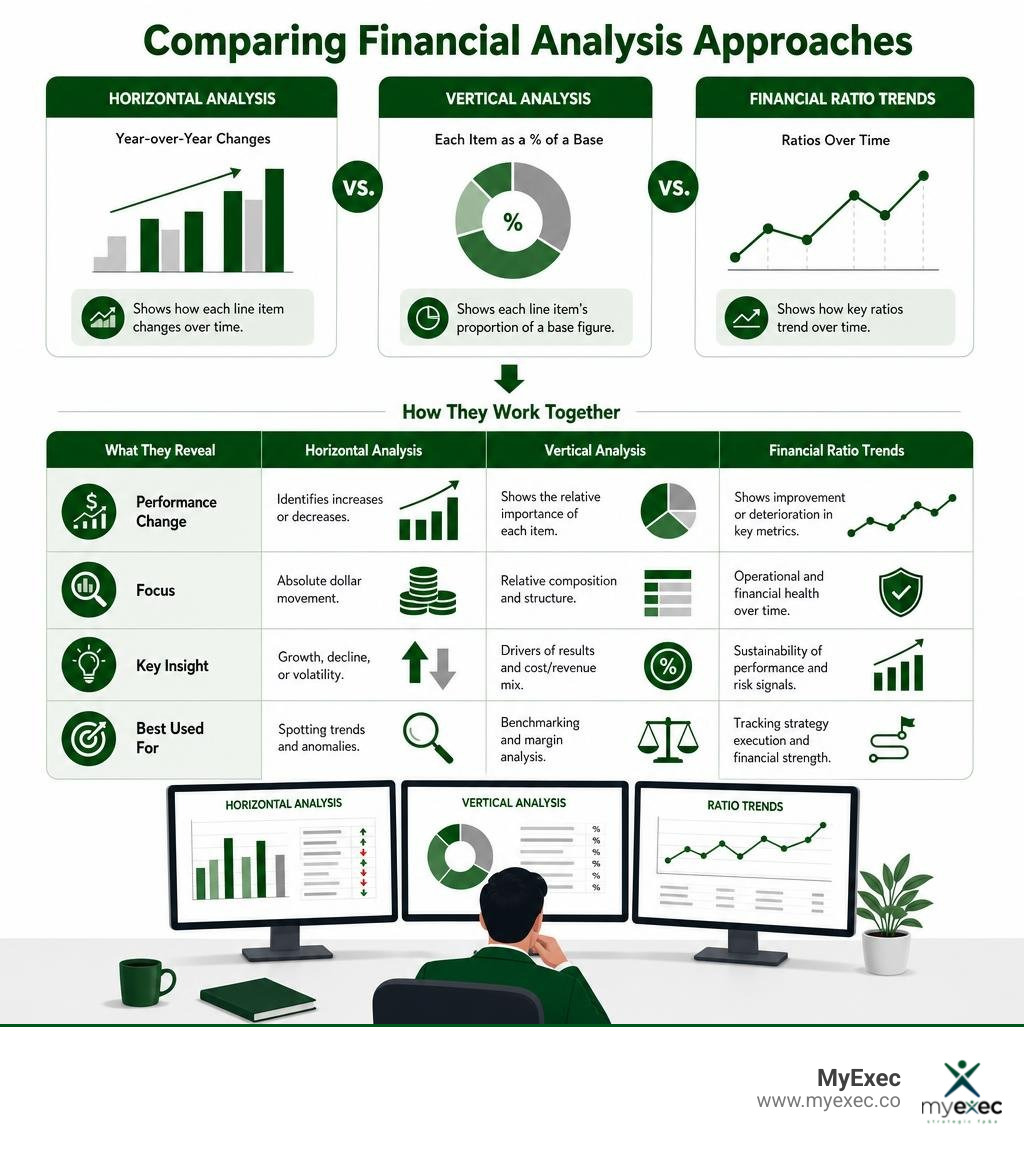
Raw financial numbers become truly useful once evaluated using comparative techniques. Translating raw data into standardized terms lets executives compare performance against historical baselines and industry benchmarks.
Vertical and Horizontal Analysis Techniques in Financial Reporting and Financial Statement Analysis
Two primary comparative tools form the backbone of baseline analysis:
- Vertical Analysis (Common-Size Analysis): Converts each line item into a percentage of a single base figure within the same period. On the income statement, all line items are divided by total net sales. On the balance sheet, items are divided by total assets. This standardizes companies of different sizes for direct operational comparison.
- Horizontal Analysis (Trend Analysis): Compares specific financial line items across sequential time periods to highlight growth rates and operational shifts.
$$\text{Percentage Change} = \frac{\text{Current Period Amount} - \text{Base Period Amount}}{\text{Base Period Amount}} \times 100$$
Combining vertical and horizontal techniques highlights operational shifts, such as rising SG&A costs relative to revenue growth.
Core Ratios for Assessing Business Performance
Ratio analysis converts financial data into targeted metrics that measure operational performance across four core financial categories:
- Profitability Ratios: Measure the business's ability to turn sales into profit. Key metrics include Return on Invested Capital (ROIC), Return on Equity (ROE), and Gross Profit Margin.
- Liquidity Ratios: Evaluate short-term debt coverage. The Current Ratio measures current assets relative to current liabilities, while the Quick Ratio excludes inventory to test immediate cash availability.
- Leverage Ratios: Examine long-term debt sustainability and capital structure risk, primarily via Debt-to-Equity and Interest Coverage ratios.
- Activity (Efficiency) Ratios: Assess how efficiently management utilizes business assets, measured by metrics like Inventory Turnover and Accounts Receivable Turnover.
Detailed applications of these ratios are explained in our guide to generating a Ratio Analysis Report.
Summary of Key Financial Ratio Categories
| Ratio Category | Common Formulas | Core Insight Provided |
|---|---|---|
| Profitability | Gross Margin = Gross Profit / Revenue ROE = Net Income / Equity |
Evaluates pricing power, operational cost control, and net return on owner equity. |
| Liquidity | Current Ratio = Current Assets / Current Liabilities Quick Ratio = (Cash + Receivables) / Current Liabilities |
Measures capacity to pay near-term short-term obligations without selling fixed assets. |
| Leverage | Debt-to-Equity = Total Debt / Total Equity Interest Coverage = EBIT / Interest Expense |
Assesses overall balance sheet solvency, financial leverage, and ability to service debt. |
| Activity | Inventory Turnover = COGS / Average Inventory A/R Turnover = Net Credit Sales / Average A/R |
Shows operational speed and efficiency in collecting cash and turning inventory into sales. |
Financial Reporting Best Practices for Growing Businesses
For growing middle-market businesses between $5M and $50M in revenue, financial reporting must move beyond annual tax prep to support active strategic decisions. Reports should help leaders answer three practical questions: what changed, why it changed, and what action the business should take next.
Maintaining Data Quality and GAAP Standards
To deliver strategic value, accounting systems must comply with the "Four C's" of high-quality financial data:
- Correct: Accurate entries verified by consistent reconciliations.
- Current: Up-to-date data maintained on a set close schedule rather than delayed until quarter-end.
- Complete: Full capture of all accruals, prepayments, deferred revenues, and period liabilities.
- Consistent: Standard application of accounting methods across sequential reporting periods.
Automating accounting software and adopting cloud systems helps reduce manual entry errors, maintain clear audit trails, and keep records audit-ready. Learn more in our overview on maintaining Audited Financial Statements.
What CFOs Look For in Reporting Reviews
In CFO-led reporting reviews, the goal is not just to confirm that the books are closed. The finance team looks for early warning signs that affect cash, margin, and enterprise value. For a $5M to $50M business, the most useful review points often include:
- Close cadence: Whether monthly financials are available quickly enough for leaders to act before small issues become quarterly surprises.
- Gross margin movement: Whether pricing, labor, materials, or service delivery costs are changing faster than revenue.
- Working capital pressure: Whether receivables, inventory, or payables are quietly consuming cash despite reported profitability.
- Budget vs. actual variance: Whether management understands the operational cause behind each major revenue or expense deviation.
- Forward cash visibility: Whether the company can translate financial statements into a 13-week cash flow forecast and capital plan.
To connect financial statement insights directly with strategic operational key performance indicators, read our overview on building executive Business Performance Metrics.
Frequently Asked Questions
What is the main difference between financial reporting and financial statement analysis?
Financial reporting focuses on gathering, organizing, and presenting operational financial data into standard statements like the balance sheet and income statement. Financial statement analysis takes those finished reports and applies comparative tools, ratios, and trend evaluations to interpret operational performance, assess risk, and guide executive decision-making.
Why is accrual accounting preferred over cash accounting in financial reports?
Accrual accounting matches expenses directly to the revenues they generate within the exact period the underlying economic activity occurs. This eliminates timing distortions caused by delayed customer payments or lump-sum vendor receipts, providing a far more accurate view of true profitability and operating performance.
How can non-finance leaders start interpreting financial statements?
Non-finance leaders should begin by converting standard income statements into vertical common-size reports, where every expense is displayed as a percentage of total sales. Focusing on three key financial metrics (gross profit margin, current ratio, and operating cash flow) and tracking month-over-month variances provides clear visibility into financial trends without requiring a formal accounting degree.
What should a business owner review first in financial statements?
A business owner should start with revenue trends, gross margin, operating cash flow, and accounts receivable aging. These areas quickly show whether growth is profitable, whether cash is keeping pace with earnings, and whether customers are paying on time.
Which ratios matter most for a growing business?
The most useful ratios for a growing business are gross profit margin, current ratio, quick ratio, debt-to-equity, interest coverage, and accounts receivable turnover. Together, they show profitability, liquidity, leverage risk, and how efficiently the company converts sales into cash.
When does financial reporting need CFO-level support?
Financial reporting usually needs CFO-level support when revenue growth creates more complex cash flow, debt, investor reporting, acquisition planning, or multi-entity operations. At that stage, leadership needs forward-looking analysis, not just historical statements.
Strengthening Business Performance Through Strategic Financial Leadership
As business revenue scales past $5M toward $50M, accounting complexity quickly outgrows founder-led management and basic bookkeeping systems. Growing middle-market firms need strategic finance leadership to translate financial statements into clear operational strategies, accurate cash flow models, and value-accretive capital decisions.
At MyExec, we provide flexible, full-stack fractional CFO and FP&A services tailored specifically to mid-market companies. Our team brings deep operational experience across businesses ranging from multi-million-dollar middle-market firms to enterprise organizations.
Rather than relying on a single retained individual, our full-stack model offers flexible access to both senior CFO leadership and dedicated analytical FP&A support. We adapt our support to match your growth phase:
- Designing executive dashboards, key performance indicators, and automated reporting systems.
- Running monthly Budget vs. Actual variance analysis and 13-week cash flow forecasts.
- Capital planning, debt structuring, and formal business valuations led by an on-staff Certified Valuation Analyst (CVA).
- Preparing your business to transition smoothly to a full-time, in-house CFO when growth warrants it.
To discover how modern reporting frameworks drive real enterprise value, explore our guide on how to Increase Business Value with Smarter Financial Reporting or explore our full suite of strategic advisory services at MyExec.