Step-by-Step Guide to Cash Flow Forecasting
Fundamentals of Cash Flow Forecasting: Components, Types, and Positioning

To master the cash flow forecasting process, you have to start with the foundational elements of cash management. Finance teams often mix up cash positioning and cash forecasting, but they serve two distinct purposes in operational finance.
Cash positioning is the daily operational practice of aggregating real-time bank account balances across operational, payroll, and international accounts. It tells you exactly what liquid funds you hold right now. Cash forecasting takes that starting point and projects where your liquidity will be over dynamic time horizons using operational data, sales pipelines, and scheduled commitments.
| Dimension | Cash Positioning | Cash Forecasting |
|---|---|---|
| Time Horizon | Daily / Immediate (1–5 Days) | Forward-Looking (13 Weeks to 12 Months+) |
| Primary Goal | Prevent overdrafts & optimize daily liquidity | Predict cash shortfalls & support capital decisions |
| Primary Data Source | Bank portals & API transaction feeds | ERP schedules, AR aging, sales pipelines & budgets |
| Core Focus | Reconciliation & execution | Strategic FP&A & working capital planning |
Every complete cash model consists of five basic line items:
- Opening Balance: Verified liquid cash currently sitting in company bank accounts.
- Operating Receipts: Actual cash collected from customers, service contracts, and asset sales.
- Operating Disbursements: Cash leaving the account for payroll, supplier invoices, software, rent, and taxes.
- Net Cash Movement: Total receipts minus total disbursements for the selected time bucket.
- Closing Balance: Opening cash balance plus net cash movement, which serves as the opening balance for the next period.
Matching the forecast duration to your business objective is critical. Standard practice breaks forecasts into three core horizons:
- Short-Term Forecasts (1 to 13 Weeks): Tactical, highly detailed models updated weekly. The 13-week cash flow forecast is the standard for operational cash visibility, debt covenant tracking, and private equity sponsor updates.
- Medium-Term Forecasts (3 to 12 Months): Used for annual planning, tax obligation planning, and guiding working capital needs.
- Long-Term Forecasts (1 to 5 Years): Strategic projections tied to multi-year corporate models. These support enterprise planning, capital expenditure programs, and major financing events.
For mid-market companies evaluating long-range planning, aligning operational cash models with structural core statements is essential. Learn more about linking your cash model to broader corporate projections in our guide on Forecasting Financial Statements.
Direct vs. Indirect Methods in the Cash Flow Forecasting Process
Choosing the right calculation methodology directly dictates your model accuracy.
The direct method projects future cash levels using actual expected transaction receipts and cash disbursements. Because it pulls directly from bank data, confirmed Accounts Receivable (AR) schedules, and Accounts Payable (AP) software, it is the most accurate approach for short-term operational management (1 to 13 weeks).
The indirect method starts with net income from the income statement and adjusts for non-cash items (like depreciation, amortization, and stock-based compensation) alongside changes in working capital assets and liabilities. This approach is best suited for strategic FP&A multi-year modeling because it connects cash generation directly to long-term income trends.
| Method | Best Use Case | Key Advantage | Primary Limitation |
|---|---|---|---|
| Direct Method | Short-term liquidity (1–13 Weeks) | High accuracy for immediate cash timing | Requires granular invoice and payment data |
| Indirect Method | Medium/Long-term FP&A (1–5 Years) | Easily bridges P&L projections to cash balances | Obscures near-term cash collection timing risks |
Accrual accounting records revenues when earned and expenses when incurred, creating significant timing gaps relative to actual cash movement. A company can sign a $500,000 contract today, but if terms are Net-60 and the customer pays late, zero cash enters the bank for 90 days. Exploring the underlying relationship between accounting statements is covered in detail in our breakdown of P&L Balance Sheet Insights.
The 7-Step Cash Flow Forecasting Process
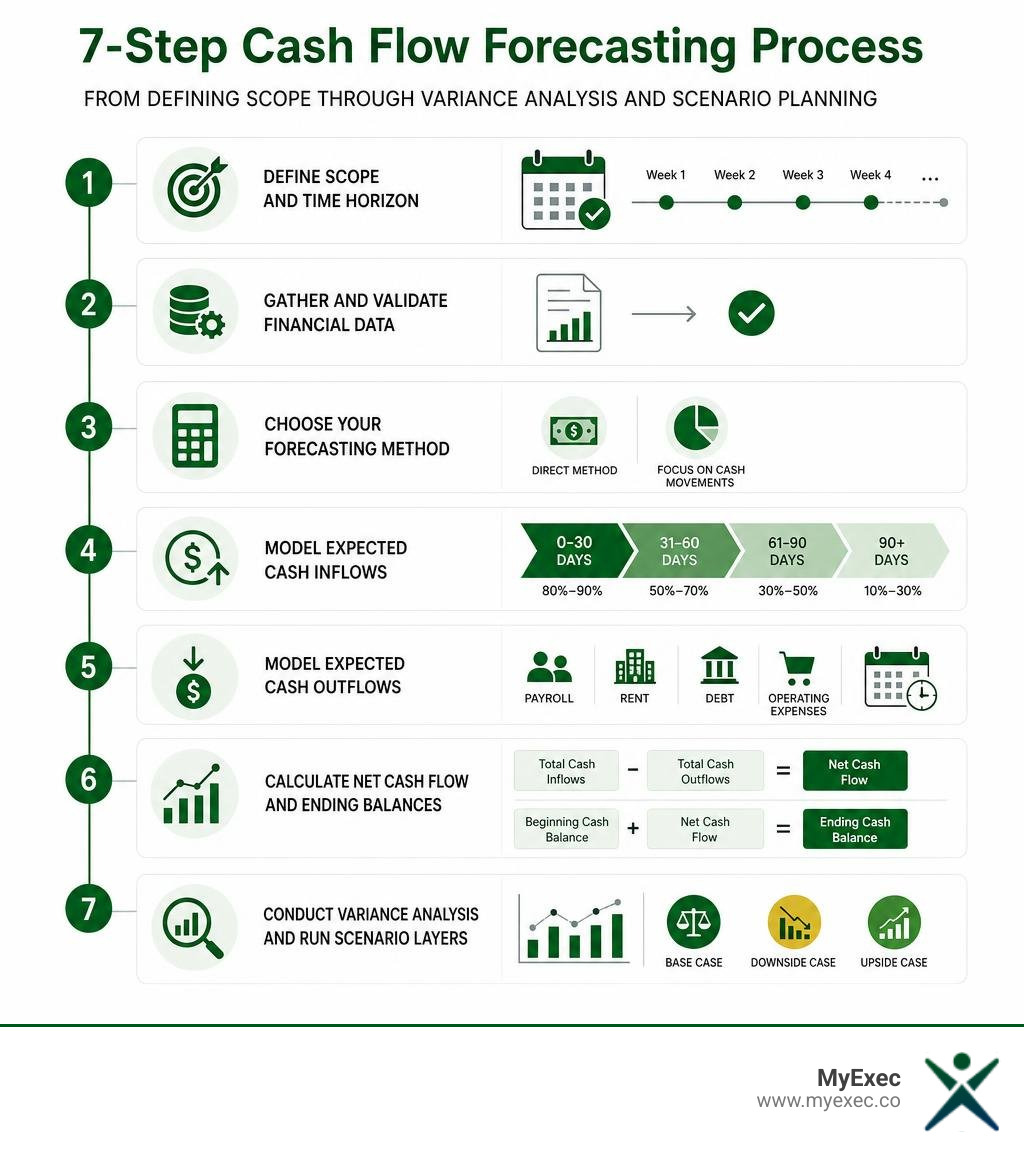
Building an operational model requires a structured, step-by-step approach. Each step should connect to the next so the forecast starts with clean source data, translates that data into cash timing, and then improves through variance analysis.
Step 1: Define Your Scope and Time Buckets
Start by identifying every account and entity that affects available cash. Include operating, savings, payroll, tax, debt service, and international accounts so the model reflects total liquidity instead of one isolated bank balance. Then choose the forecast horizon and time bucket based on the decision the model needs to support.
Use daily buckets for immediate 1 to 4 week liquidity control, weekly buckets for a rolling 13-week forecast, and monthly buckets for annual working capital planning. A U.S. business with tight payroll timing or lender reporting requirements usually benefits from a weekly 13-week view because it balances useful detail with manageable maintenance.
Step 2: Gather and Verify Foundational Source Data
Pull reconciled bank balances as the starting point before adding forward-looking assumptions. The opening balance should tie to current bank data, not a stale general ledger balance, because small timing differences can distort the entire forecast.
Collect AR aging reports, pending billings, AP schedules, vendor payment dates, payroll obligations, employer taxes, benefit schedules, rent, software, utilities, debt service, tax payments, and planned capital expenditures. Assign an owner to each input so finance knows who is responsible for updating sales collections, procurement spend, payroll timing, and one-time cash events.
Step 3: Choose Your Forecasting Method
For near-term operational control, use the direct method because it starts with actual expected cash receipts and disbursements by date. Build it from bank balances, confirmed customer collections, AR aging, AP schedules, payroll dates, debt service, tax payments, and planned one-time outflows.
Non-cash items like depreciation, amortization, accruals, and bad debt reserves are not direct-method inputs because they do not represent money entering or leaving the bank. Those adjustments belong in the indirect method, which starts with projected net income and then bridges accounting profit to cash by adjusting for non-cash expenses and working capital changes. For a rolling 13-week forecast, the direct method usually gives finance leaders better visibility into short-term liquidity, covenant risk, and operating runway.
Step 4: Model Expected Cash Inflows
Relying on invoice payment terms alone will distort your model. Build inflow assumptions from historical customer behavior, current AR aging, known billing schedules, and the probability that open pipeline will actually close and convert into cash.
Apply weighted probability adjustments across customer payment buckets. Current AR might carry an 80% to 90% collection assumption within terms, while invoices 31 to 60 days past due may need a 50% to 70% assumption. Older balances should be modeled more conservatively. This keeps the forecast from overstating near-term liquidity when a large customer regularly pays late.
Step 5: Model Expected Cash Outflows
Categorize fixed expenses, variable operating costs, and one-time disbursements separately. Fixed expenses include payroll, rent, insurance, debt service, and recurring software. Variable outflows include supplier payments, commissions, inventory purchases, tax payments, and project-specific spending.
Schedule each disbursement by the actual payment run date rather than the invoice receipt date. This helps finance leaders see when cash will leave the business and whether minimum cash reserves will be tested before the next major collection cycle. For growing companies, the most common misses often come from quarterly taxes, annual renewals, hiring plans, and delayed vendor payments that were not captured in the right week.
Step 6: Calculate Net Cash Flow and Ending Balances
Apply the primary financial formulas across each period bucket:
$$\text{Net Cash Flow} = \text{Total Cash Inflows} - \text{Total Cash Outflows}$$ $$\text{Ending Cash Balance} = \text{Beginning Cash Balance} + \text{Net Cash Flow}$$
Carry each ending balance forward as the next period’s beginning balance. Then compare projected balances against minimum liquidity thresholds, loan covenants, payroll requirements, and operating cash reserves. If the model shows a shortfall, finance can test specific responses, such as accelerating collections, delaying discretionary spend, adjusting payment timing, or securing financing before the cash gap becomes urgent.
Step 7: Conduct Variance Analysis and Run Scenario Layers
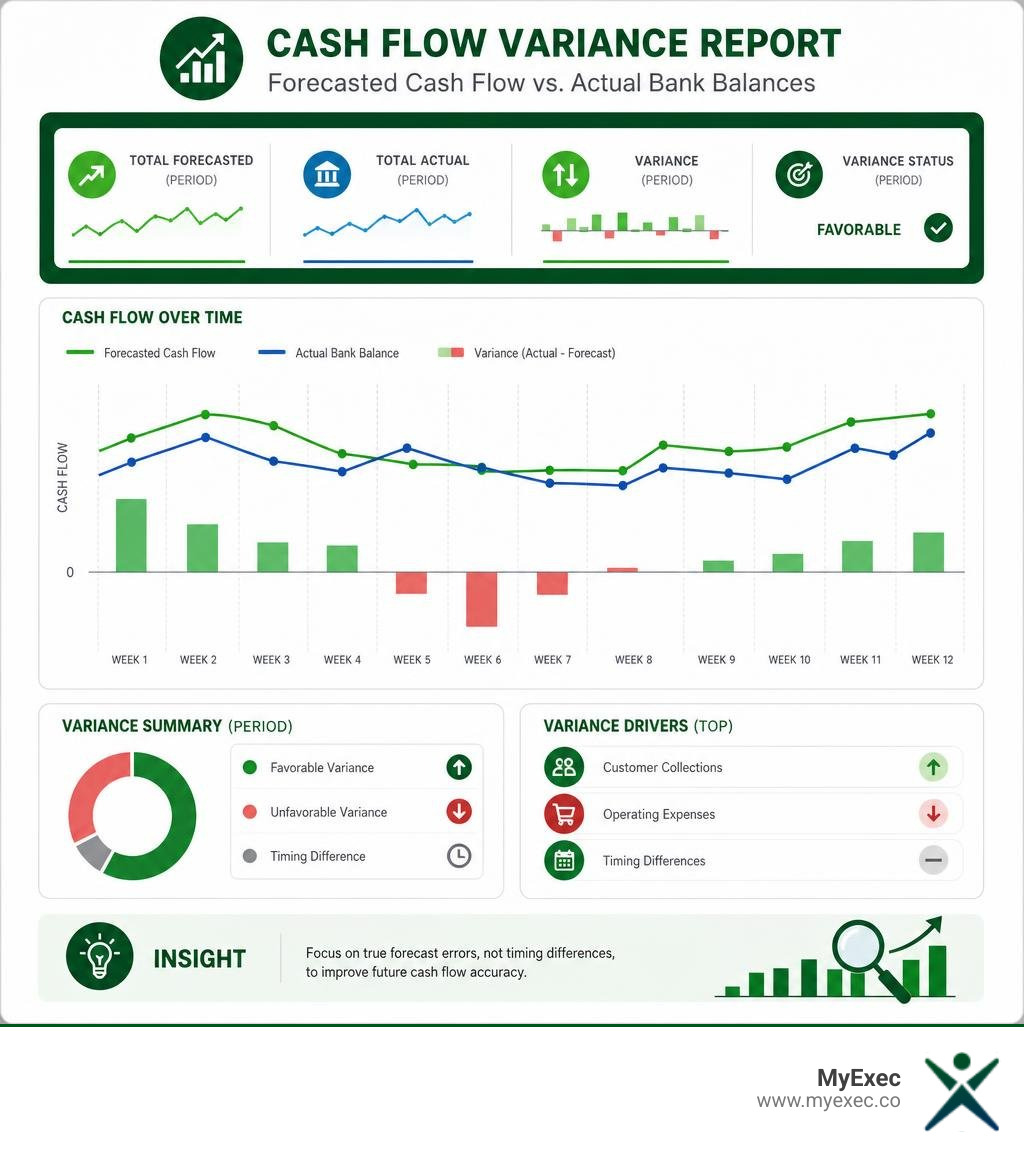
Establish a weekly cadence to compare prior forecast assumptions against actual bank results. Identify whether each variance came from timing, amount, missing data, or a true operating change. A customer payment that arrives three days late may be a timing issue, while a defaulted invoice or unplanned repair is a true forecast error.
Use those findings to refine collection assumptions, vendor payment timing, and operating spend forecasts. Then layer scenarios on top of the base case. A downside case might assume the top three customers pay 30 days late while sales drop by 15%. An upside case might assume faster collections and earlier pipeline conversion. These scenarios turn the model from a static spreadsheet into a decision tool for working capital planning, lender communication, and cash runway management.
For additional strategies on identifying structural liquidity bottlenecks before they affect operations, read our strategic guide on Spotting Cash Flow Issues Faster. You can also learn how to build stress-test models in our walkthrough on Scenario Vs Sensitivity Analysis.
Overcoming Common Challenges in Cash Flow Forecasting
Even structured financial models can hit unexpected roadblocks due to manual data errors or poor departmental alignment.
Spreadsheet-based forecasting is especially vulnerable when mid-market businesses rely on complex multi-tab workbooks without version controls, clear ownership, or automated verification checks. Even small formula issues, outdated links, or manual input mistakes can reduce forecast reliability.
Key challenges that disrupt accuracy include:
- Data Fragmentation: Financial inputs scattered across disconnected bank portals, billing platforms, ERP systems, and internal expense trackers.
- Uncoordinated Business Units: Operational units (sales, legal, procurement) altering spend or contract terms without informing the finance team.
- Late Customer Payments: Assuming customers pay strictly on invoice due dates without accounting for actual payment behavior.
- Over-Optimistic Sales Projections: Counting unbooked sales pipeline deals as guaranteed near-term cash inflows.
- Ignoring Seasonality and Irregular Outflows: Forgetting non-monthly expenses like quarterly tax deposits, annual insurance premiums, or software renewals.
Establishing visibility over these moving pieces requires structured financial reporting tools. Learn how to centralize your key financial metrics in our overview of building a Financial Reporting Dashboard.
Optimizing Accuracy Within the Cash Flow Forecasting Process
Continuous improvement requires active variance tracking and regular model refinements.
Strong financial leadership sets a clear accuracy target for the rolling 13-week direct cash forecast, then reviews performance against that target every week. Reaching a dependable forecast standard requires moving away from static invoice aging metrics. Modern finance teams evaluate payment behavior using customer payment cohorts.
For example, tracking billing cohorts over several months might show that while invoice terms state Net-30, a specific key account consistently pays well after the due date. Updating your forecast logic to match actual customer behavior eliminates artificial short-term liquidity spikes.
To maintain continuous accuracy, establish a strict root-cause variance loop:
When reviewing line-item variances, separate timing differences from true forecast errors:
- Timing Differences: A $50,000 customer payment scheduled for Friday arrives on Monday. Total cash remains unchanged, but the time bucket shifted.
- True Forecast Errors: A customer defaults on an invoice, or an unbudgeted operational repair requires immediate payment.
Closing the feedback loop every week helps turn your forecast into a reliable strategic tool. It also highlights opportunities for structural expense adjustments, which we discuss in our guide to Cost Structure Optimization.
Modernizing Treasury: Automation and Best Practices

Manual spreadsheet updates consume valuable finance hours and introduce operational lag. Industry research published by the Association for Financial Professionals shows that automating liquidity management can yield productivity gains of up to 90% in cash management workflows while boosting forecast accuracy by 40% to 50%.
Transitioning to automated bank feeds and direct API integrations gives finance leaders real-time visibility across all accounts. This eliminates manual logins and reduces input mistakes.
To maintain a disciplined forecasting workflow, follow these proven best practices:
- Secure Executive Sponsorship: Ensure leadership enforces timely submission of operational data across sales, legal, and operational teams.
- Maintain a Weekly Refresh Cadence: Update rolling 13-week models every week using reconciled bank data.
- Separate Cash from Accounting Accruals: Focus exclusively on bank transaction dates rather than revenue recognition dates.
- Automate Direct Data Ingestion: Connect your core ERP, billing, and banking systems directly via financial APIs.
- Establish Cross-Departmental Communication: Meet regularly with procurement and sales leaders to catch large cash movements before they hit bank accounts.
Implementing scalable FP&A infrastructure often requires guidance from strategic finance experts. Read more about how specialized modeling support helps growing companies in our article on The Role Of A Financial Modeling Consultant In Business Strategy.
Frequently Asked Questions About Cash Forecasting
What is the primary difference between a cash flow forecast and a cash flow statement?
A cash flow statement is a formal financial statement that records past cash movements across operating, investing, and financing activities for a completed period. A cash flow forecast is a forward-looking operational tool that projects anticipated cash inflows and outflows over future daily, weekly, or monthly periods to help manage liquidity.
How often should a business update its cash flow forecast?
Short-term operational models (such as a rolling 13-week cash flow forecast) should be updated weekly using reconciled bank transaction data. Medium- and long-term forecasts covering 3 to 12 months should be refreshed at the beginning of each month to adjust for updated operational budgets and strategic goals.
Can a profitable business still experience cash flow failure?
Yes. Profit measures net income under accrual accounting rules, recognizing revenue when earned rather than when received. If a business experiences rapid revenue growth but faces 60- to 90-day customer payment delays, it can run out of liquid cash to cover immediate payroll, tax, or inventory expenses despite showing high P&L profitability.
Conclusion: Mastering Strategic Cash Flow Management
A structured cash flow forecasting process gives business leaders clear visibility into future liquidity. Moving from reactive accounting to forward-looking financial tracking helps protect cash reserves, optimize capital decisions, and keep your business solvent through every growth stage.
Building, maintaining, and automating continuous cash models requires deep FP&A capability. Mid-market companies between $5M and $50M in revenue frequently outgrow founder-led finance, but they do not always need a full-time, high-overhead executive suite.
At MyExec, we deliver flexible, full-stack fractional CFO and FP&A services tailored to your exact business stage. Our team provides scalable finance support: from hands-on financial analyst modeling to strategic CFO guidance. We have worked across companies ranging from a few million in revenue up to roughly $2B, including private equity owned, closely held, publicly traded, and non-profit organizations. Our team also includes a Certified Valuation Analyst (CVA) on staff to support complex corporate valuations and transaction preparation.
Whether you need to set up a 13-week rolling cash forecast, automate multi-entity cash visibility, or guide long-term capital strategy, we provide the leadership to make it happen.
Take control of your operational runway today. Explore Fractional CFO & Strategic Finance Services with MyExec to build a cash management process that supports confident growth.