

How to Calculate Product Profitability in 4 Easy Steps
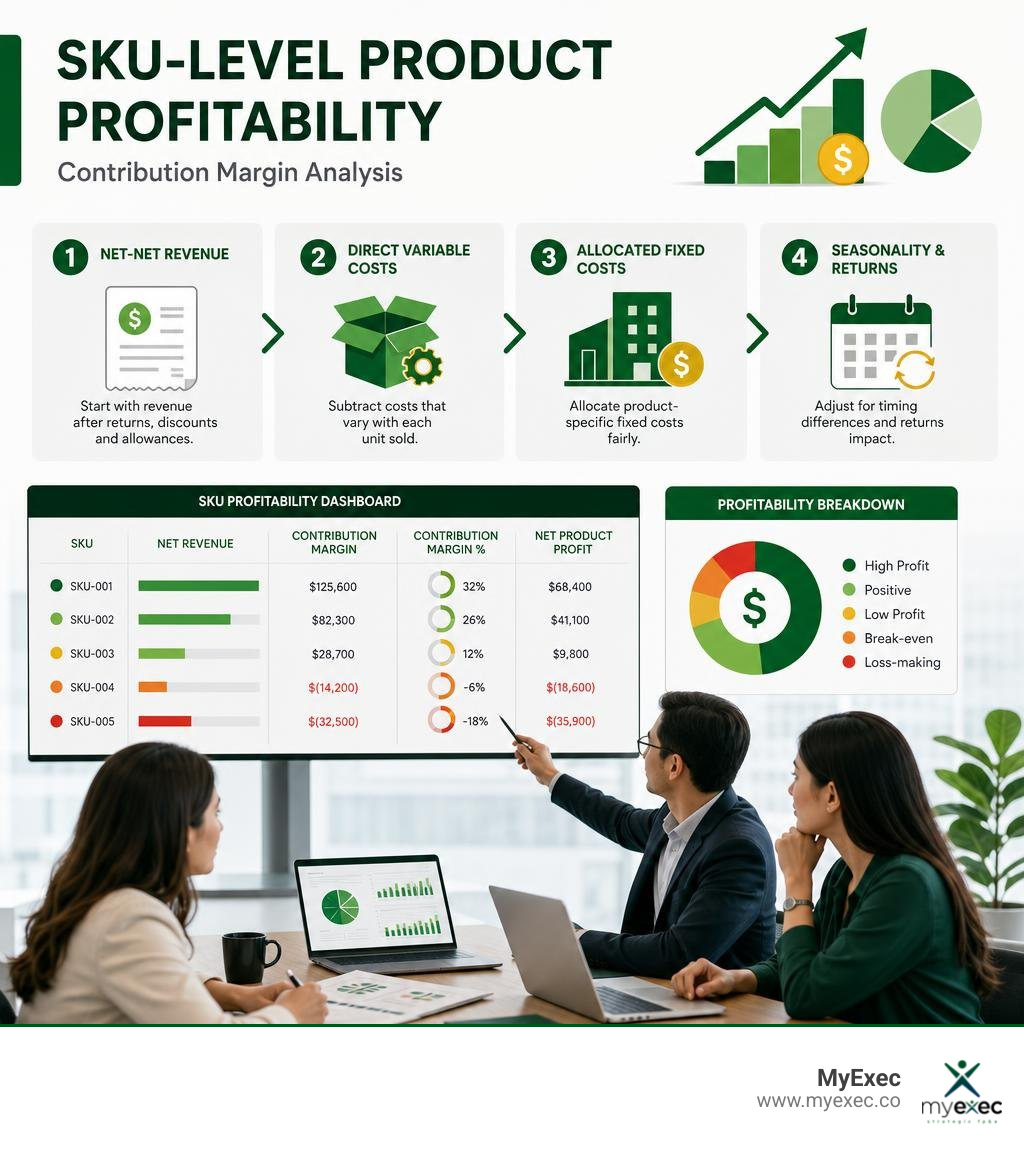
When Revenue Growth Stops Telling the Whole Story
Product profitability represents the net financial contribution of an individual product after subtracting every cost associated with manufacturing, marketing, selling, and supporting it. It differs fundamentally from gross margin and top-line revenue; it reveals what a product actually contributes to your bottom line once you account for the full operational picture.
Key Takeaways:
- Definition: Total revenue generated by a specific SKU minus all direct and allocated indirect costs.
- Primary Metrics: Contribution margin (revenue minus variable costs) and net product profit (revenue minus variable and allocated fixed costs).
- Strategic Value: High-revenue products can quietly destroy enterprise value if hidden operational costs consume their margins.
- Measurement Process: A systematic four-step approach: define net-net revenue, isolate direct variable costs, allocate product-specific fixed costs, and adjust for seasonality and returns.
- Ownership: Shared cross-functionally among product management, finance, and operations.
Many mid-market companies experience a common paradox: revenue climbs 20% to 30% year-over-year, the sales pipeline looks robust, and new product launches succeed on paper—yet net operating profit remains flat.
This disconnect almost always stems from a product profitability issue.
Most growing businesses understand which products sell, but very few know which products actually make money. A high-volume SKU with a 20% return rate, heavy promotional discounting, and unallocated advertising spend can easily run at a negative margin. Meanwhile, a lower-volume, low-maintenance SKU might be funding the entire business. Without SKU-level measurement, managing by a blended average hides both your true profit engines and your cash drains.
Data shows that roughly 20% of products generate 80% of a company's total contribution margin. The remaining 80% of the catalog often consumes disproportionate warehouse space, administrative focus, and working capital without delivering a viable return.
For businesses scaling between $5M and $50M in revenue, identifying these dynamics is one of the highest-leverage opportunities available. You do not necessarily need more sales; you need to know where your existing sales are most profitable.
This guide outlines a practical, four-step framework to calculate SKU-level profitability, isolate hidden operational costs, and choose the right costing methodology for your business.

Why Measuring True Product Profitability Matters
As businesses scale past the $5M revenue threshold, they often face rapid product proliferation. Founders and product teams launch new variants, sizes, colors, or service bundles to capture incremental market share. On paper, each addition looks like a strategic win.
However, catalog expansion introduces significant operational friction. This friction creates hidden expenses that standard, blended profit and loss (P&L) statements fail to capture. Measuring true product profitability is essential to expose this margin erosion before it impacts cash flow.
Relying on top-line revenue growth as a primary success metric is a high-risk strategy. It assumes that increased sales volume automatically translates to higher profits. In reality, supply chain shifts, input cost inflation, and operational complexity frequently squeeze margins at the individual SKU level, even as total sales rise.
A rigorous profitability analysis uncovers the actual economic value of each product. By looking beyond basic gross margin to evaluate the total cost to serve, you can identify which products fund your growth and which ones drain your resources.
To maintain a healthy bottom line, companies must track specific profitability metrics at the SKU level. For example, research indicates that a mere 1% increase in average selling price can boost operating profit by 12.3%, assuming volume remains constant.
Conversely, cost-reduction initiatives often fall short. On average, companies achieve only 48% of their cost-saving targets, primarily because complexity costs are difficult to isolate and eliminate. This challenge is particularly acute for mid-sized firms. While smaller businesses with narrow product lines maintain tight margin visibility, medium-sized companies with broad catalogs often suffer from severe margin dilution. Focusing on SKU-level economics allows you to reverse this trend and protect your operating margins.
The Hidden Costs Distorting Your Margins
A common mistake among growing businesses is relying solely on gross margin to evaluate product performance. Gross margin only accounts for direct cost of goods sold (COGS)—such as raw materials and direct manufacturing labor. It completely overlooks the operational layers that determine whether a product is actually profitable.
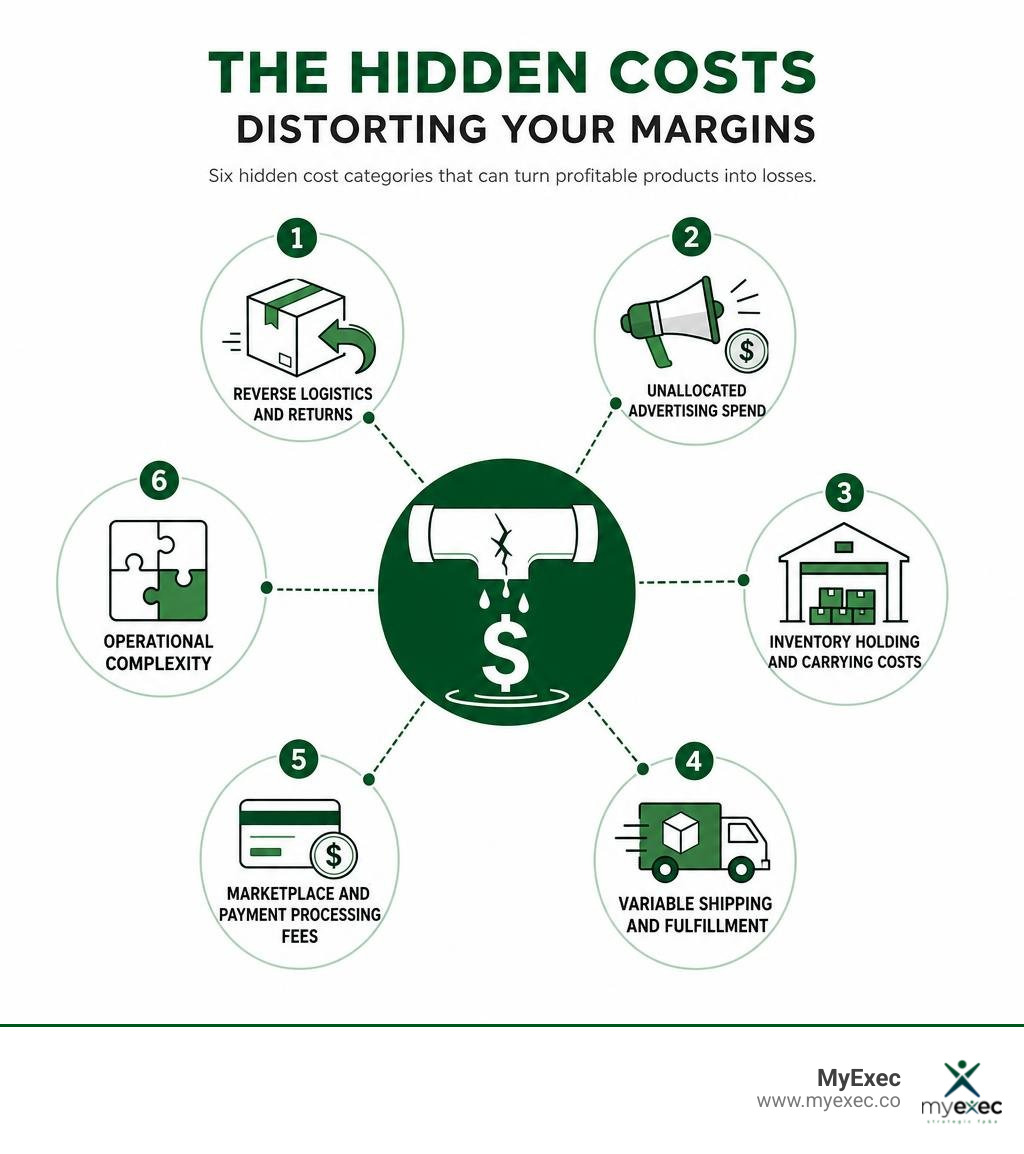
Failing to attribute operational expenses to specific products leads to distorted margins. Some of your highest-revenue products may actually be net-negative assets once you account for these six hidden cost categories:
- Reverse Logistics and Returns: A return involves much more than lost revenue. It incurs return shipping fees, warehouse receiving labor, quality inspections, and potential inventory write-downs. In e-commerce apparel, return rates often range from 15% to 40%. If your profitability model does not attribute these costs to the specific SKUs being returned, you are overstating your margins.
- Unallocated Advertising Spend: Standard marketing reports typically track ad spend at the campaign level. This makes it easy to miss when a low-margin SKU absorbs a disproportionate share of your paid acquisition budget.
- Inventory Holding and Carrying Costs: Slow-moving inventory ties up working capital and occupies valuable warehouse space. Storage, insurance, and handling costs should be allocated to products based on their average days on hand, rather than spread evenly across the entire catalog.
- Variable Shipping and Fulfillment: Heavy, bulky, or fragile items cost significantly more to pick, pack, and ship. Standard 3PL or Amazon FBA fees can range from $3 to $12+ per unit based on dimensions, which can quickly wipe out the margins of lower-priced items.
- Marketplace and Payment Processing Fees: Credit card processing fees (such as Shopify Payments at 2.6% to 2.9% plus $0.30 per transaction) and marketplace referral fees (which range from 8% to 17% on Amazon) must be deducted at the transactional SKU level.
- Operational Complexity: Products with complex manufacturing requirements, frequent quality control issues, or high customer support demands consume a disproportionate amount of staff time and overhead.
To identify and plug these margin leaks, businesses must transition from basic accounting to a structured cost structure optimization process. This involves mapping operational expenses directly to the specific products that drive them. By running a detailed contribution margin analysis, you can isolate these variable operational costs and see exactly how much cash each SKU contributes to covering your fixed overhead.
How to Calculate Product Profitability in 4 Steps
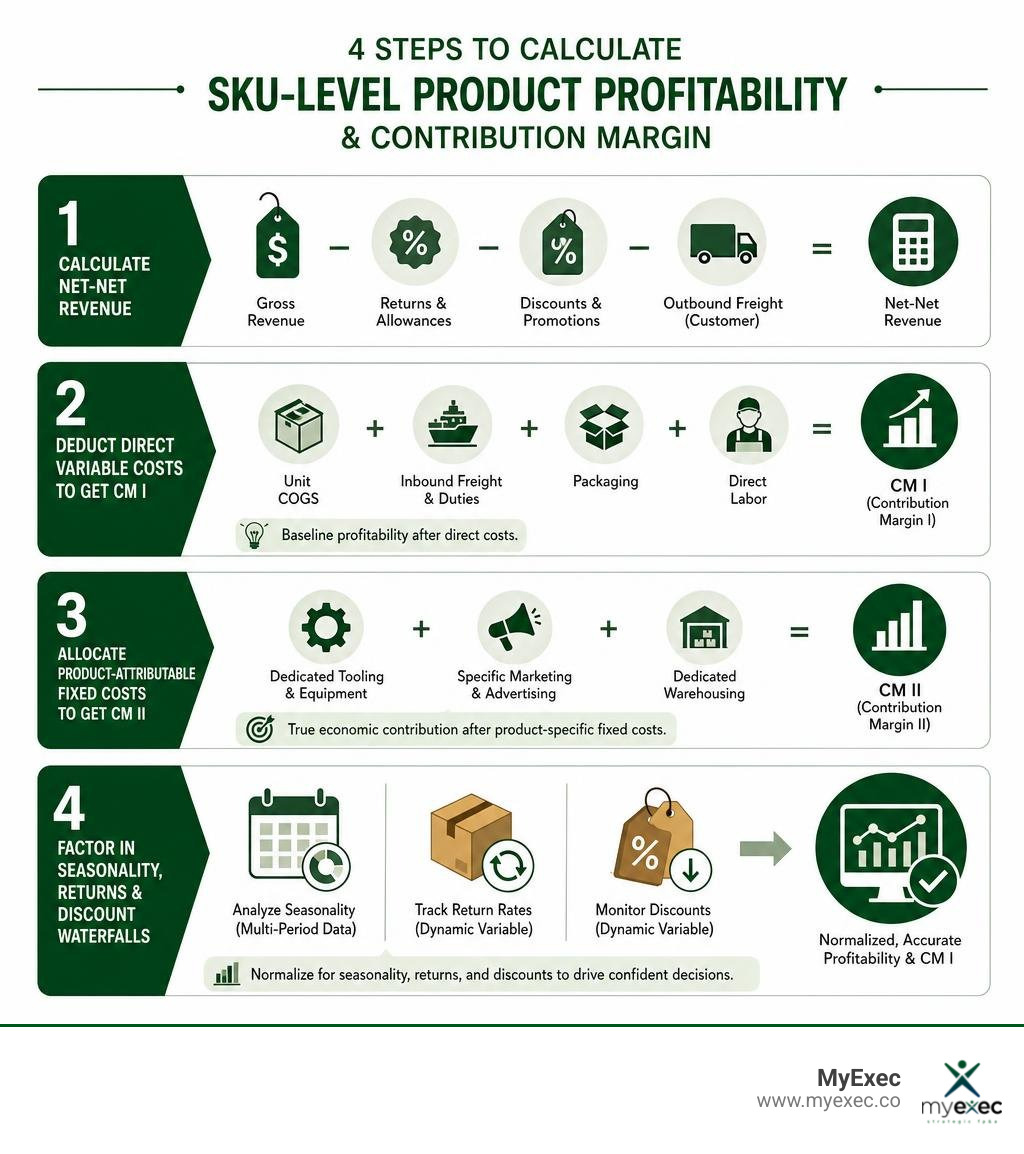
Building a reliable product profitability model requires moving away from spreadsheet-based guesswork toward a systematic framework. This four-step process helps mid-market operators calculate real SKU-level margins, enabling stronger profit and loss management across the entire portfolio.
Step 1: Define the Product Hierarchy and Net-Net Revenue
First, establish a clear product taxonomy. Group your products logically by SKU, product line, and category. This keeps your analysis organized while providing granular visibility where it matters most.
Next, calculate your net-net revenue per product. Many companies mistakenly use gross sales as their starting point. To find your true top line, build a revenue waterfall that deducts every discount, rebate, promotion, and return at the individual SKU level.
Start with your gross list price. Subtract standard customer discounts, volume rebates, promotional allowances, and the retail value of returned units. The remaining figure is your net-net revenue—the actual cash that enters your business from that product.
Step 2: Identify Direct Variable Costs (CM I)
Once you have your net-net revenue, subtract the direct variable costs associated with producing and delivering that specific unit. This calculation yields your Contribution Margin I (CM I), which represents the baseline profitability of your product before any fixed costs are applied.
Your direct variable costs must include:
- Unit COGS: Raw materials, ingredients, or direct manufacturing costs.
- Inbound Freight and Duties: The cost to transport inventory to your warehouse, including ocean freight, customs broker fees, and duties.
- Packaging: Direct product packaging and shipping boxes.
- Direct Labor: If you perform assembly, kitting, or customization in-house, include the direct touch labor per unit.
Subtracting these direct variable costs from your net-net revenue yields your CM I. This metric tells you whether a product is viable at a basic production level. If a SKU has a negative or razor-thin CM I, no amount of scale will make it profitable.
Step 3: Allocate Product-Attributable Fixed Costs (CM II)
The next layer of profitability is Contribution Margin II (CM II). To calculate CM II, identify and subtract fixed costs that are directly caused by a specific product or product line, but do not scale directly with unit volume.
These product-attributable fixed costs include:
- Dedicated Tooling and Equipment: Depreciation on machinery, molds, or software used exclusively for that product line.
- Specific Marketing and Advertising: Dedicated ad campaigns, product-specific influencer partnerships, or packaging design fees.
- Dedicated Warehousing: Storage space reserved exclusively for a specific product category.
Subtracting these attributable fixed costs from your CM I gives you CM II. This is a critical metric for strategic decision-making, as it shows the true economic contribution of a product line after accounting for the dedicated resources required to support it.
Step 4: Factor in Seasonality, Returns, and Discount Waterfalls
To ensure your product profitability model remains accurate over time, you must account for seasonal fluctuations, shifting return rates, and discount trends. Analyzing a single month can lead to poor decisions; a product that looks highly profitable in December might be a cash drain in July.
To normalize these variations, build a seasonal index using multi-period historical data. Compare identical periods year-over-year rather than month-over-month to eliminate seasonal distortions.
Additionally, track return rates and markdown percentages as dynamic variables in your model. If a product experiences a sudden spike in returns or requires heavy discounting to clear shelf space, you should adjust the SKU's net-net revenue and CM I in your model. This continuous, multi-period analysis ensures you make decisions based on stable trends rather than temporary market spikes.
Costing Methodologies: Standard Costing vs. Operative Costing vs. Activity-Based Costing
To build an accurate profitability model, you must choose the right costing methodology. Many mid-market businesses rely on traditional standard costing, which is often pre-built into their ERP systems. However, standard costing has major limitations when used for strategic decision-making.
Standard costing typically allocates overhead costs mechanically, often using direct labor hours or total sales volume as the primary driver. In modern operating environments, direct labor represents a relatively small percentage of total costs, while overhead and operational complexity represent the majority.
When you allocate overhead based solely on volume, your simple, high-volume products end up subsidizing your complex, low-volume products. This distorts your margins and can lead to pricing mistakes.
To avoid this, businesses can look to alternative costing frameworks. Activity-Based Costing (ABC) is highly accurate because it assigns costs to products based on the actual activities they consume. However, ABC is notoriously expensive, slow, and complex to implement, making it impractical for most mid-market companies.
This is where operative costing serves as a pragmatic middle ground. Operative costing refines your standard cost model by establishing logical, causal drivers for overhead and variance accounts without the administrative burden of full ABC.
For example, instead of spreading utility costs evenly, operative costing might allocate them based on machine run time or square footage. It allows you to achieve high decision-making accuracy at a fraction of the time and cost.
For companies navigating these complex costing models, leveraging the role of a financial modeling consultant in business strategy can be highly valuable. A professional consultant can help you design a customized costing framework that balances accuracy with operational usability.
| Methodology | Accuracy | Complexity | Best Use Case |
|---|---|---|---|
| Standard Costing | Low | Low | External financial reporting |
| Operative Costing | High | Medium | Mid-market strategic decisions |
| Activity-Based Costing | Very High | High | Large enterprises with deep resources |
Turning Product Profitability Insights into Strategic Decisions
Calculating your product-level margins is only half the battle. The real value comes when you use these insights to drive strategic business decisions. Armed with accurate SKU-level data, you can optimize your pricing, clean up your catalog, and align your leadership team around profitability rather than just top-line growth.
To execute these changes effectively, many businesses partner with professional advisors to design tailored pricing strategy services that align with their operational realities.
Using Product Profitability to Drive Pricing Strategy
Price is your fastest and most powerful lever for margin improvement. A minor adjustment to your pricing structure can have a massive impact on your bottom line, provided you understand your product-level economics.
With detailed product profitability data, you can:
- Raise Prices on Hidden Losers: Identify high-volume products that run on thin margins due to hidden operational costs, and implement targeted price increases to restore profitability.
- Enforce Discount Discipline: Set strict discount limits on low-margin SKUs while allowing sales teams more flexibility on high-margin items.
- Optimize Product Mix: Shift your marketing and promotional focus toward products with strong contribution margins, maximizing the profitability of every dollar spent on customer acquisition.
Portfolio Rationalization and SKU Sunsetting
Product proliferation is a silent margin killer. Over time, catalogs naturally accumulate a long tail of slow-moving, low-margin products that consume warehouse space, complicate operations, and tie up working capital.
SKU rationalization is the process of identifying and removing these underperforming products. To do this safely, you must analyze customer buying behavior alongside margin data.
If a low-margin SKU is frequently purchased alongside a highly profitable hero product, discontinuing it could hurt your overall sales. In these cases, you can guide customers toward a "next best product" alternative, allowing you to phase out the unprofitable SKU without losing the customer relationship.
Cross-Functional Alignment for Product Profitability
Achieving sustainable product profitability requires deep collaboration across your entire organization. Too often, different departments operate with conflicting goals, which naturally creates operational friction.
For example, your sales team might want a broad product range to satisfy every customer request, while your operations team struggles with the inventory holding costs and complexity of managing a massive catalog. Meanwhile, your marketing team might drive traffic to low-margin products because they are easier to sell.
To resolve this, you must establish a shared, data-driven foundation. Align your sales incentives with contribution margin rather than gross revenue, ensuring your sales representatives are motivated to sell your most profitable products.
By fostering regular collaboration between product management, finance, and operations, you can ensure every department is working toward the same financial goals.
Frequently Asked Questions about Product Profitability
How often should a mid-market company run a product profitability analysis?
A mid-market company should run a product profitability analysis on at least a quarterly cadence. In volatile markets with fluctuating input costs, freight rates, and advertising expenses, waiting for an annual review is risky.
Quarterly reviews allow you to catch margin drift early, adjust pricing before profit leaks compound, and optimize your inventory spend ahead of seasonal shifts.
Should we discontinue a product if it has a negative net profit but positive contribution margin?
Not necessarily. If a product has a positive contribution margin, it generates more revenue than its variable costs, meaning it helps cover your company's shared fixed overhead.
If you discontinue the product, those fixed overhead costs will not disappear. Instead, they will be redistributed to your remaining products, which could make your overall portfolio look less profitable.
You should only discontinue a product with a positive contribution margin if you can replace it with a higher-margin product that utilizes the same capacity.
How do we allocate shared overhead costs without distorting SKU economics?
To avoid distorting SKU economics, you should never allocate general corporate overhead, like executive salaries or head office rent, to individual products. These costs are not caused by specific SKUs and belong below your Contribution Margin II layer as shared corporate expenses.
For overhead costs that are directly tied to operations, like warehouse utilities or shipping labor, allocate them using physical, causal drivers rather than revenue. Use metrics like weight, volume, pallet space, or machine run hours to ensure each product absorbs its fair share of operational expenses.
Conclusion
Calculating and optimizing product profitability is not a one-time accounting project. It is a continuous strategic discipline that directly impacts your cash flow, working capital, and enterprise value.
For growing U.S. businesses between $5M and $50M in revenue, outgrowing founder-led finance is a natural milestone. Managing a complex product catalog requires senior financial leadership, sophisticated forecasting, and KPI design that goes far beyond basic bookkeeping.
At MyExec, we provide flexible, fractional CFO and FP&A services tailored to your business stage. Our full-stack finance approach is scalable, meaning you can access analyst-level execution, senior CFO strategy, or a mix of both depending on your current needs.
We have worked with companies ranging from a few million in revenue to roughly $2B, helping them turn complex operational data into clear, actionable decisions. Our goal is to help you grow until a full-time CFO makes sense, then help you transition cleanly.
If you are ready to stop guessing which products drive your business forward, explore our MyExec Services today.