When a Revenue Multiple Works for Valuing a Company
The Mechanics of Company Valuation Based on Revenue

Company valuation based on revenue relies on a straightforward calculation: multiplying a company's sales figure by an industry-derived benchmark. While the math is simple, selecting the right revenue baseline requires careful scrutiny. Analysts typically use either trailing twelve months (TTM) normalized revenue or annual recurring revenue (ARR) for subscription models.
Normalizing revenue involves stripping out one-time windfalls, unusual customer prepayments, non-operating income, or discontinued product lines. The goal is to isolate repeatable top-line performance that a buyer can expect to continue post-transaction. According to the U.S. Chamber guide on business valuation methods, evaluating a business through top-line multiples serves as a helpful baseline, but it must reflect consistent operational reality rather than unadjusted accounting totals.
What Is a Revenue Multiple and How Is It Derived?
A revenue multiple expresses the relationship between a company's Enterprise Value (EV) and its annual sales. Enterprise value represents the total theoretical takeover price of the business, accounting for both equity value and net debt.
$$\text{Revenue Multiple} = \frac{\text{Enterprise Value}}{\text{Annual Revenue}}$$
Public markets frequently quote a related metric called the price-to-sales (P/S) ratio, which divides market capitalization by total revenue. For private middle-market transactions, EV/Revenue is the standard because it normalizes for variations in capital structure and debt load between target companies.
Market capitalization and enterprise value are related, but they answer different questions. Market capitalization is the value of a public company's outstanding shares. Enterprise value starts with that equity value, then adds debt and subtracts cash because a buyer typically assumes the company's debt while gaining access to its cash. For a private-company transaction, enterprise value is usually the more useful starting point because it lets buyers compare businesses with different capital structures.
Market sentiment, cost of capital, and comparable transaction datasets establish baseline multiple ranges. For instance, according to data from public M&A transactions, historical deals demonstrate wide valuation bands. Elon Musk's 2022 acquisition of Twitter closed at approximately 8.7x annual revenue ($44 billion purchase price against roughly $5.077 billion in revenue) despite operating losses. In contrast, standard retail businesses typically trade between 0.3x and 1.0x annual sales, while broad small-to-mid-sized enterprises trade between 0.5x and 3.0x revenue, according to private market transaction data reported by Calculover and Hakaru.io benchmarks in 2026.
Key Drivers That Expand or Compress Top-Line Multiples
Two businesses generating identical top-line figures rarely command the same multiple. Buyers apply substantial premiums or discounts based on specific underlying performance characteristics:
- Gross Margin Profile: High gross margins (such as 75% to 85% in software) leave substantial capital to fund operations, marketing, and profit after covering direct delivery costs. Low gross margins (15% to 30% in distribution or manufacturing) severely constrain cash flow generation.
- Net Revenue Retention (NRR): An NRR rate exceeding 110% to 120% proves that existing accounts expand their spend over time, offsetting natural client churn and reducing acquisition pressure.
- Year-over-Year Growth Rate: Sustainable, predictable growth drives top-line expansion. High growth acts as a powerful multiplier, frequently lifting valuations significantly above slower-growing peers.
- Recurring vs. Re-earned Revenue: Contractually committed subscription revenue provides visibility into future cash flows, justifying a higher price than transactional sales where every dollar must be re-won.
- Customer Concentration: Heavy reliance on a handful of clients creates downside risk. Understanding the risks tied to customer concentration is essential, as having more than 20% of revenue tied to a single customer routinely triggers valuation haircuts from prudent buyers.
When Revenue Multiples Work: Fit by Business Model and Growth Stage
Revenue multiples give a practical valuation framework when current profitability doesn't reflect underlying economic value. This happens when companies intentionally trade short-term operating profit for rapid market capture, or when upfront customer acquisition expenses depress current-period margins.
When Company Valuation Based on Revenue Makes Sense for High-Growth Startups
In early-stage and growth-stage tech companies, capital allocation priorities heavily favor top-line expansion. When a business invests aggressively in research and sales development, standard accounting reports zero or negative EBITDA. Valuing these businesses on current earnings would produce an erroneous zero or negative enterprise value.
For SaaS business models, buyers and venture investors assess performance using frameworks like the Rule of 40, which states that a company's year-over-year growth rate plus its operating margin should equal or exceed 40%. According to industry benchmarks compiled by Calculover (2024 to 2026), growth-stage SaaS companies growing under 20% YoY often trade around 5x to 8x ARR, while firms expanding over 100% can achieve 15x to 25x ARR, with hypergrowth companies surpassing 40x in competitive capital environments.
In these scenarios, high customer lifetime value (LTV) relative to customer acquisition cost (CAC) validates the economic logic: the business can generate significant free cash flow once it scales and trims discretionary expansion spend.
Subscription, Media, and Marketplace Companies
Revenue-based metrics also apply well to established subscription, digital media, and two-sided marketplace platforms. These models benefit from distinct structural characteristics:
- Low Marginal Cost of Delivery: Serving additional digital subscribers requires minimal incremental overhead.
- High Predictability: Multi-year contracts or programmatic retainers create reliable baseline cash flows.
- Network Effects: Marketplaces gain competitive moats as user liquidity deepens, protecting future take rates.
When analyzing these companies, investors focus on unit economics rather than static P&L margins. If subscriber lifetime value stays multiples above acquisition cost, top-line revenue serves as an accurate proxy for future terminal earnings.
Common Pitfalls and Limitations in Lower-Middle-Market Transactions
Applying revenue multiples indiscriminately across private companies creates significant blind spots. Top-line metrics ignore operating expenses, capital expenditures, debt service, and working capital needs. Building a comprehensive business valuation framework means evaluating whether sales actually convert into distributable cash.
Why Company Valuation Based on Revenue Misleads in Mature Services and Manufacturing
For mature middle-market companies ($5M to $50M in revenue) operating in industrial manufacturing, commercial construction, logistics, or professional services, revenue multiples are often deeply misleading.
In these sectors, every dollar of revenue carries significant variable delivery costs. A custom machine shop must purchase raw steel, maintain specialized CNC equipment, and employ skilled labor. An engineering consultancy faces substantial payroll and direct project overhead.
Buyers in these industries don't acquire market share for future conversion. They purchase existing cash flow streams. So transaction pricing aligns with EBITDA multiple valuation standards or Seller's Discretionary Earnings (SDE). Relying on top-line rules of thumb obscures operational inefficiencies, high capital reinvestment requirements, and tight working capital cycles.
Worked Comparison: $20M Revenue Company Valued via Revenue vs. EBITDA Multiples
To see how relying solely on top-line multiples creates substantial valuation disconnects, consider two distinct businesses, each generating $20 million in annual revenue.
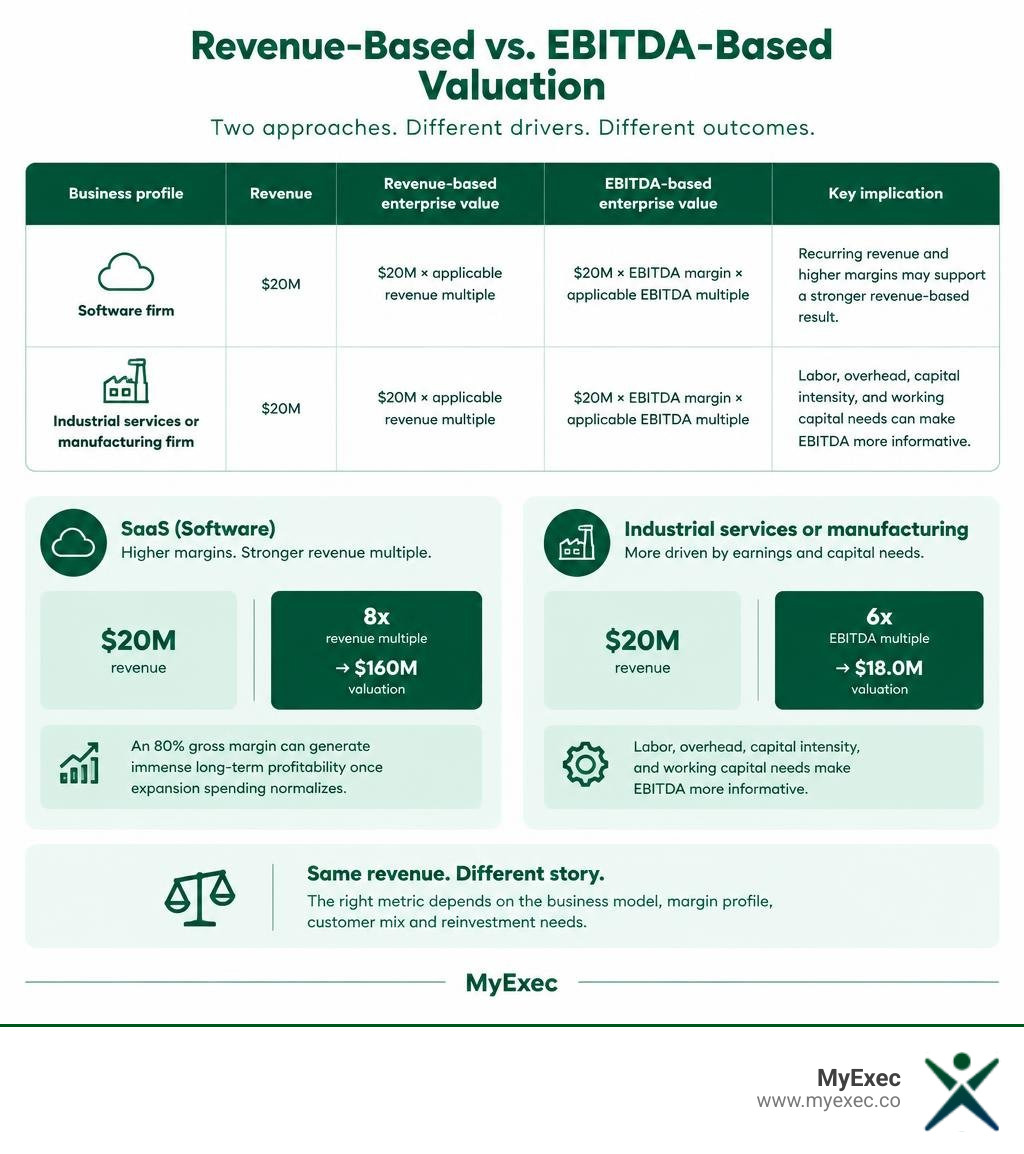
- Company A (Enterprise SaaS): Generates $20M in pure subscription ARR with an 80% gross margin, 25% YoY growth, and a 10% EBITDA margin ($2.0M EBITDA) as it reinvests in growth.
- Company B (Precision Industrial Services): Generates $20M in project revenue with a 30% gross margin, 5% YoY growth, and a 15% EBITDA margin ($3.0M EBITDA) after accounting for heavy equipment maintenance and operational payroll.
| Business profile | Revenue | Revenue-based enterprise value | EBITDA-based enterprise value | Key implication |
|---|---|---|---|---|
| Software firm | $20M | $20M × applicable revenue multiple | $20M × EBITDA margin × applicable EBITDA multiple | Recurring revenue and higher margins may support a stronger revenue-based result. |
| Industrial services or manufacturing firm | $20M | $20M × applicable revenue multiple | $20M × EBITDA margin × applicable EBITDA multiple | Labor, overhead, capital intensity, and working capital needs can make EBITDA more informative. |
If an owner tries to value Company B using generic mid-market revenue multiples (say, 2.5x to 4x), they might calculate an enterprise value between $50M and $80M. But an institutional buyer evaluating Company B will focus on its $3.0M EBITDA. Applying a standard 6x industrial EBITDA multiple yields an enterprise value of $18.0M (equivalent to 0.9x revenue).
On the other hand, Company A might easily command an 8x ARR multiple ($160M valuation) because an acquirer recognizes that its 80% gross margin can generate immense long-term profitability once expansion spending normalizes. Customer mix, margin profile, and reinvestment requirements explain the entire divergence.
Navigating the Valuation Gap in Lower-Middle-Market M&A
Valuation disconnects remain the primary hurdle in middle-market transactions. Deal flow data from middle-market M&A platforms indicates that while buyer competition drives premium prices for top-performing businesses, a meaningful share of broken transactions collapse due to mismatched valuation expectations between buyers and sellers.
When sellers price their business using top-line multiple headlines from unrelated industries, negotiations stall early. Bridging this gap requires disciplined preparation, clear deal structuring, and identifying potential valuation cost drivers well before entering the market. If an earnings gap exists, structured earnouts, seller financing, or equity rollovers can align incentives while protecting downside risk.
Transitioning From Revenue Benchmarks to Strategic Enterprise Value
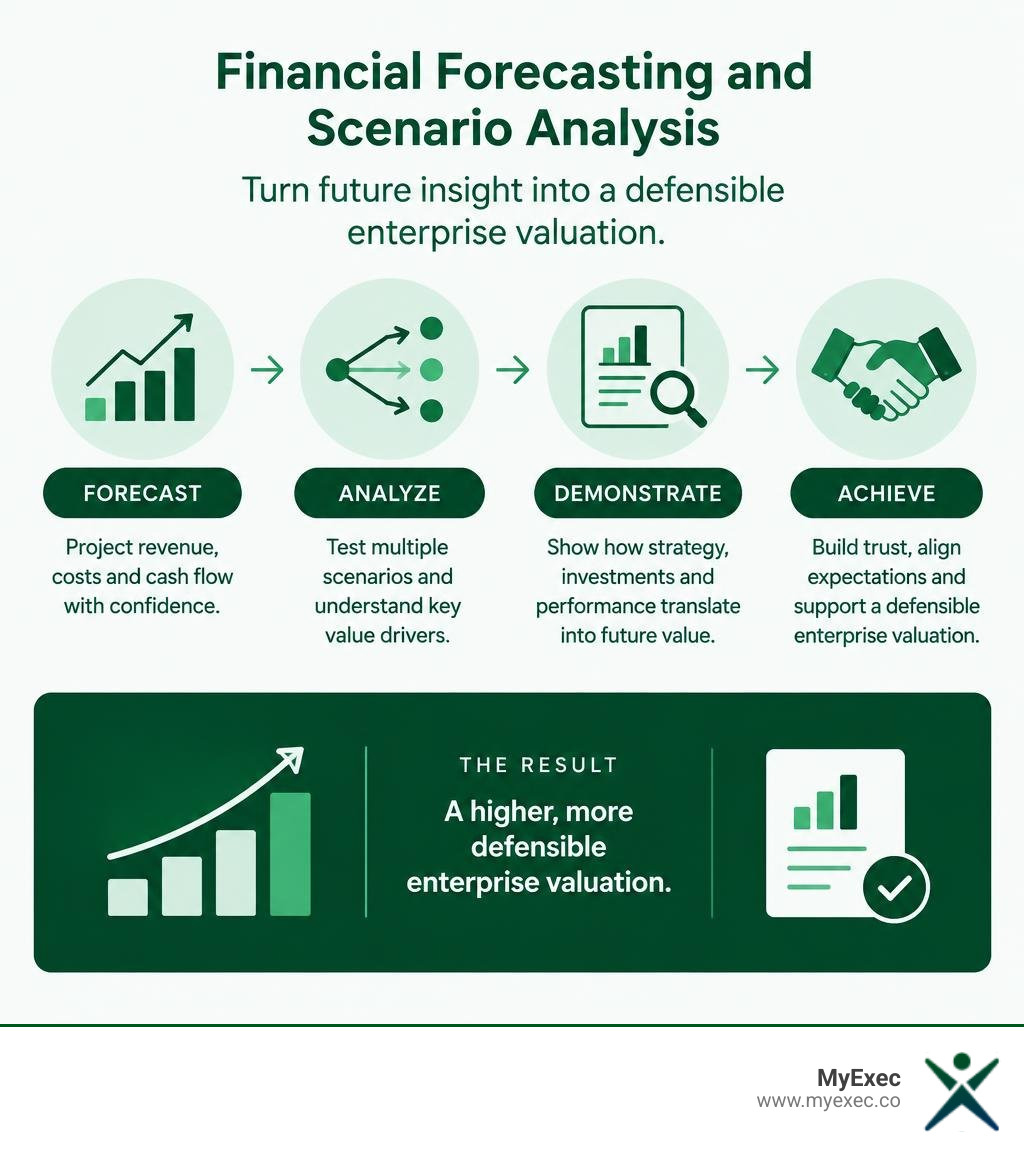
To command defensible valuations, growing businesses must transition from rough top-line rules of thumb to integrated financial visibility. Establishing reliable forecasting allows leadership to demonstrate how operational investments translate into future cash flows.
Increase business value with smarter financial reporting by replacing backward-looking static books with forward-looking operational models. We have helped multiple clients improve enterprise value through planning, forecasting, and dynamic scenario modeling. Our work includes sensitivity and scenario analysis that helps leadership make better decisions and improve cash flow and value over time, as well as advanced analysis, decision support, and margin optimization.
We have built integrated three-statement models for new product launches and mergers and acquisitions, implemented cash flow forecasts and rolling 13-month P&L forecasts, improved the quality and speed of monthly reporting, and implemented KPI scorecards tracking customer acquisition cost, average revenue per customer, and net revenue retention. This financial rigor gives buyers the clarity they need to underwrite premium valuations.
Frequently Asked Questions About Revenue-Based Valuation
What is a typical revenue multiple for a small to mid-sized business?
For most privately held small-to-mid-sized businesses ($5M to $50M in revenue), typical revenue multiples range between 0.5x and 3.0x annual sales, according to market transaction data from Calculover and Hakaru.io. Service firms with low capital requirements and steady cash flows generally trade between 1.0x and 2.0x revenue, while traditional retail and distribution companies often trade below 1.0x due to lower gross margins. High-growth technology firms with defensible proprietary IP and subscription retention frequently trade at higher multiples.
Why do SaaS companies command higher revenue multiples than manufacturing firms?
SaaS companies command higher multiples due to superior gross margins (often 70% to 85%), high customer retention, and low marginal costs of scaling. Once software is developed, onboarding incremental users requires minimal additional capital. In contrast, manufacturing and industrial service firms must continually fund direct materials, labor, physical equipment maintenance, and working capital, which caps free cash flow conversion.
How does customer concentration impact a revenue-based valuation?
Customer concentration introduces operational fragility. If a company generates more than 20% to 25% of its revenue from a single client, buyers typically apply a substantial discount to the valuation multiple or mandate aggressive earnout structures. A loss of a primary customer severely damages top-line scale, making customer diversification a critical factor in defending a multiple.
Grounding Your Valuation in Sustainable Earnings
Top-line multiples offer a quick snapshot, but sustainable enterprise value is always rooted in the ability to convert sales into distributable cash. For founders and executive teams navigating growth, fundraising, or an eventual exit, relying on casual revenue multiples creates unnecessary risk.
MyExec provides flexible, scalable fractional CFO and FP&A services that bridge the gap between day-to-day bookkeeping and high-level strategic finance. Our full-stack finance approach pairs analytical execution with senior CFO leadership, supporting clients based on their needs, complexity, and stage. We've worked across companies ranging from a few million in revenue to roughly $2B, including nonprofits, private equity-owned, closely held, and publicly traded companies. We also provide capital allocation expertise to help businesses deploy resources efficiently. Our goal is to help your business build the financial foundation it needs to scale sustainably until a full-time in-house CFO makes sense, at which point we help define the role, select the right leader, and manage a clean transition.
If you're preparing for a capital event, strategic planning cycle, or partner buyout, our team includes a Certified Valuation Analyst (CVA) on staff to provide rigorous analysis. Explore our business valuations practice to ground your company's worth in defensible, market-tested financial models.