Cash Management for Businesses After the Fed's September Hike
Executive Cash Management for Business in a Rising-Rate Environment

On September 16, 2026, the Federal Reserve raised the target range for the federal funds rate by 25 basis points to 3.75% to 4.00%. That move is the immediate context for this discussion because higher benchmark rates can increase the cost of variable-rate borrowing, change the return on idle cash, and narrow the margin for error in working-capital decisions. Read the Federal Reserve’s policy statement.
For mid-market businesses, the purpose of cash management is not simply to retain more cash or pursue the highest available yield. It is to make deliberate choices about liquidity, debt, collections, and reserves so the company can meet near-term obligations while keeping capital productive. This article outlines a practical framework for sizing operating reserves, deploying surplus liquidity, evaluating variable-rate credit lines, improving working capital, and preparing for lender and board scrutiny.
Higher borrowing costs change the arithmetic of a balance sheet. When commercial borrowing rates rise, leaving large operational balances in non-interest-bearing checking accounts creates a measurable opportunity cost. At the same time, chasing yield with funds that may be needed for payroll, taxes, or critical vendors can create a liquidity problem at exactly the wrong time.
That tradeoff is why cash management for business should be treated as an operating discipline, not an administrative chore. The strongest treasury approach separates working capital by purpose, time horizon, and access requirement. For mid-market businesses between $5M and $50M in revenue, that usually means distinguishing operational cash, a core liquidity buffer, and genuine surplus funds. Each bucket should have a defined owner, target balance, approved uses, and escalation process when balances move outside the intended range.
A practical cash-management policy also makes decisions repeatable. Rather than debating every large payment or line draw from scratch, leadership can use a documented framework that identifies the minimum operating balance, the cash forecast assumptions, approved investment or sweep options, and the point at which finance must notify the CEO, board, or lender. This creates faster decisions without sacrificing control.
Sizing Operational Reserves: Cash Management for Business Solvency
The starting point for liquidity planning is establishing a realistic operating cash reserve. A baseline target of three to six months of operating expenses gives many businesses enough breathing room, but the right reserve is not a generic multiple. It should reflect revenue predictability, customer concentration, gross-margin stability, access to credit, and the timing of major obligations.
To set your liquidity buffer:
- Calculate true monthly fixed obligations: Factor in payroll, commercial rent, critical software licensing, insurance, debt service, and unavoidable vendor commitments rather than using a simple average of total historical spend.
- Map cash conversion cycle volatility: Review collections variance during seasonal low periods, delayed project closeouts, and months with unusually high inventory or subcontractor spending to understand when higher levels of reserves are required.
- Audit invoice billing lag: Measure how quickly invoices go out once work finishes. Slow billing can make a healthy business appear to need a larger reserve than it would with disciplined billing operations.
- Identify concentrated cash-risk events: Include annual insurance renewals, tax payments, bonus cycles, debt maturities, and customer renewals that could materially affect liquidity in a single month.
- Stress-test the assumptions: Model a late payment from a major customer, a 10% revenue shortfall, or a two-week delay in expected financing. The reserve should cover realistic downside cases, not only the base forecast.
For a professional-services company with recurring monthly revenue, the reserve may be closer to the lower end of the range if billing is prompt and customer concentration is low. A project-based company with milestone billing, seasonal demand, or a small number of major customers may need a more substantial buffer. The goal is not to hold the maximum amount of cash. It is to maintain enough readily available liquidity to continue operating without making rushed financing or vendor-payment decisions.
If your cash buffer is too lean, an unexpected payment delay from a major customer can push you into expensive short-term borrowing. If it is too large, capital sits unproductive while your credit facilities accrue variable-rate interest. A monthly 13-week cash flow forecast is often the best bridge between these two risks. It gives management a near-term view of cash receipts, payroll, accounts payable, debt service, taxes, and planned capital spending, then highlights the weeks where cash headroom is most constrained.
For more on identifying cash flow problems early, see how to spot cash flow issues faster.
Deploying Surplus Liquidity without Sacrificing Accessibility
Once your baseline operational reserve is defined, any remaining balance can be evaluated for low-risk, highly liquid structures. The objective is straightforward: earn an appropriate return on funds that are not needed immediately while preserving access when the operating forecast changes.
Start by assigning a time horizon to each dollar of excess cash. Funds required within days should remain in immediately accessible accounts. Amounts needed within several weeks may be appropriate for overnight or short-term liquidity options. Cash not expected to be used for a quarter or longer can be evaluated separately, subject to your investment policy, risk tolerance, and lender requirements. This time-bucketed approach prevents a common treasury error: treating all bank balances as equally available and equally investable.
When evaluating liquidity structures for your business:
- Automated overnight liquidity: Structures that transfer excess operational balances above a target threshold into interest-bearing vehicles overnight and return them each business morning.
- Multi-institution deposit distribution: Programs that distribute cash balances across institutions to help preserve applicable deposit-insurance coverage while keeping operational liquidity intact.
- Short-duration liquid instruments: Conservative, short-dated vehicles for surplus reserves earmarked for tax obligations, annual bonuses, or planned capital outlays in upcoming quarters.
- Account architecture and controls: Separate operating, payroll, tax, and reserve accounts can improve visibility and reduce the chance that restricted or committed funds are mistaken for discretionary cash.
Yield should never be evaluated in isolation. Finance leaders should compare the stated yield with transfer restrictions, settlement timing, minimum balances, fees, counterparty exposure, collateral or insurance terms, and the operational effort required to manage the account. A slightly lower yield may be the better result if it preserves same-day access and avoids manual transfers during a cash crunch.
Before selecting any liquidity structure, talk with your commercial banking team. Ask what transfer cutoffs apply, how balances are protected, what fees offset stated returns, and how quickly funds can be returned to operational accounts during an emergency. Then document the decision in a short treasury policy so the controller, CFO, and executive team are working from the same rules.
Evaluating Variable-Rate Credit Lines Ahead of Year-End Policy Moves

When benchmark rates move higher, carrying balances on a variable-rate revolving credit facility becomes more expensive. Most commercial lines of credit are pegged to prime, SOFR, or another floating benchmark plus a lender margin. As the benchmark changes, the interest drag on drawn balances can rise quickly, especially for businesses that use the line as a standing source of working capital rather than a temporary bridge.
The right response is not automatically to pay down all debt. A revolving line is also a source of liquidity, and its value depends on the reliability of future draws, the timing of receivables, covenant headroom, and the business's ability to absorb a sudden expense. Leadership should evaluate both the cost of debt and the cost of being undercapitalized.
Evaluating Line Draws vs. Debt Paydown Strategies
Leadership teams must balance the cost of holding variable-rate debt against the security of having cash on hand. This decision is best made through a rolling forecast rather than a static balance-sheet snapshot.
When evaluating whether to draw, hold, or pay down an existing revolving line of credit:
- Calculate the net interest margin drag: Compare the all-in interest rate on the line, including unused-line fees or other recurring costs, against the net yield earned on interest-bearing reserves. The spread is the direct carrying cost of holding drawn capital.
- Review lender availability terms: Read the loan documentation for borrowing-base requirements, material-adverse-change provisions, covenant triggers, reporting deadlines, and lender discretion. Undrawn capacity has less value if access could be restricted when operating results weaken.
- Analyze working-capital timing: If receivables are expected over the next 30 to 60 days, paying down line balances may reduce daily interest expense, provided the operating cash buffer still covers payroll, vendor obligations, taxes, and forecast variability.
- Confirm redraw availability: Verify that a debt paydown restores undrawn capacity immediately and does not require new approvals, documentation, re-underwriting, or additional fees.
- Model downside liquidity, not only the base case: Test what happens if a major receivable is delayed, gross margin softens, or an inventory purchase arrives early. A paydown strategy that looks efficient in the base case may leave too little headroom in a realistic downside scenario.
- Separate structural borrowing from timing needs: If the business repeatedly carries the same line balance month after month, the issue may be a permanent working-capital requirement, not a short-term fluctuation. That can justify a conversation about term debt, equity, revised customer terms, or a broader capital-structure review.
A simple decision model can make the tradeoffs visible. Finance can compare three scenarios: maintain the current line balance, make a partial paydown, or repay the line fully. For each scenario, show projected interest expense, minimum weekly cash balance, undrawn availability, covenant headroom, and the effect of a delayed collection. This gives executives a more useful answer than a single recommendation based only on the current bank balance.
When working with clients on managing working capital, we frequently model these choices through sensitivity analysis. This helps executive teams understand how paydown amounts affect interest expense, cash headroom, and financing flexibility under different operating conditions.
Optimizing Working Capital: Tightening Terms and Preserving Vendor Goodwill
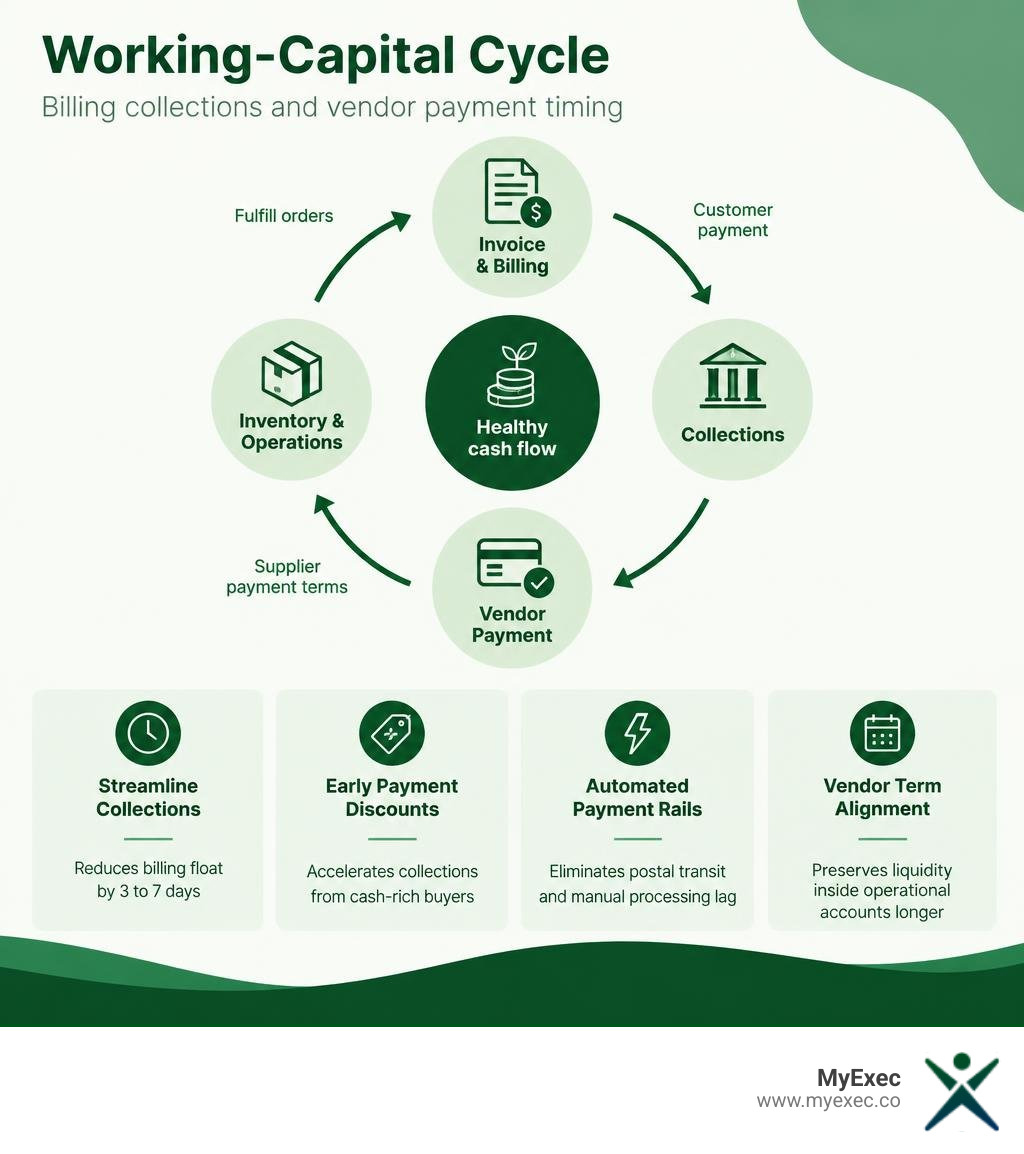
Improving your cash position does not always require new financing. Often, the fastest path to better liquidity lies in compressing your cash conversion cycle. The cash conversion cycle measures the days it takes to turn operational investments in inventory and services back into collected cash:
Cash Conversion Cycle = Days Inventory Outstanding (DIO) + Days Sales Outstanding (DSO) − Days Payable Outstanding (DPO)
Compressing this timeline requires active management across Days Sales Outstanding (DSO) and Days Payable Outstanding (DPO).
Advanced Working Capital and Cash Management for Business Growth
Tightening payment terms on customers while managing outgoing vendor payments helps self-fund operations. However, adjustments must be balanced against customer retention and supplier goodwill.
| Working Capital Lever | Operational Action | Cash Flow Impact | Risk / Counterparty Impact |
|---|---|---|---|
| Billing Velocity | Automate invoicing upon milestone completion | Reduces billing float by 3 to 7 days | None, improves operational transparency |
| Early Payment Discounts | Offer 1/10 net 30 or 2/10 net 30 to select accounts | Accelerates collections from cash-rich buyers | Slight margin concession on gross receivables |
| Automated Payment Rails | Shift commercial buyers from paper check to ACH/RTP | Eliminates postal transit and manual processing lag | Requires initial customer accounting coordination |
| Vendor Term Alignment | Request standard net 45 or net 60 terms on renewals | Preserves liquidity inside operational accounts longer | Potential friction if negotiated aggressively |
Balancing Days Sales Outstanding and Supplier Payment Terms
To improve receivables without frustrating customers, focus on resolving operational bottlenecks. Billing errors, vague contract milestones, and missing documentation cause more collection delays than customer insolvencies. Establishing automated invoice delivery, structured follow-ups at 7, 14, and 21 days past invoice date, and electronic payment options keeps receivables moving.
On the accounts payable side, pay on schedule rather than significantly early, unless an early-payment discount delivers an annualized return that exceeds your cost of capital. When negotiating terms with key suppliers, emphasize order volume and payment consistency. Good supplier relationships protect your supply chain during tight economic cycles. For a structured approach to projecting cash needs, review our cash flow forecasting process.
Preparing for Q4 Lender Covenant Reviews and Board Reporting

As commercial lenders face tighter funding conditions and heightened portfolio scrutiny, year-end covenant reviews can become more consequential. For companies carrying funded debt, managing financial ratios is just as important as maintaining operational liquidity. A business can have adequate cash today and still face lender pressure if EBITDA, leverage, fixed-charge coverage, or borrowing-base metrics are trending in the wrong direction.
The strongest preparation begins before the compliance certificate is due. Management should maintain a monthly lender-ready reporting package that reconciles operating results, cash flow, covenant calculations, and forward-looking assumptions. This improves the quality of internal decisions and gives lenders confidence that leadership understands the drivers behind the numbers.
In an anonymized engagement with a growing mid-market client, we established a structured monthly cadence where budget-versus-actual results and an integrated cash view are reviewed directly with company directors. Implementing a dedicated financial reporting dashboard helps leadership track balance-sheet ratios alongside monthly P&L performance. This makes it easier to identify potential covenant compression well before quarter-end.
Managing Debt Service Coverage and Fixed-Charge Ratios
Most credit agreements define covenant calculations based on trailing twelve-month performance, but the exact definitions in the agreement control. Finance teams should not rely on generic formulas when preparing a lender certificate. They should review the defined terms, permitted add-backs, measurement dates, and any caps or exclusions with their lender or legal adviser.
Two common debt metrics require close monitoring:
- Debt Service Coverage Ratio (DSCR): Often compares adjusted cash flow or EBITDA with principal and interest obligations. When interest rates rise on variable-rate debt, the debt-service requirement can increase and reduce covenant headroom even if operating earnings remain steady.
- Fixed-Charge Coverage Ratio (FCCR): Evaluates whether cash flow covers fixed obligations such as interest, scheduled principal payments, leases, and certain capital expenditures. The calculation may be sensitive to both declining earnings and increases in recurring obligations.
Covenant monitoring should include both a trailing view and a forward view. The trailing calculation tells you where the company stands today. The forecast shows whether planned hiring, price changes, capital expenditures, or a softer sales period could create pressure in the next quarter. This is particularly important for businesses with seasonal revenue, customer concentration, or large project milestones.
To prepare for Q4 board reviews and lender evaluations:
- Reconcile P&L and cash flow assumptions: Make sure operating expenses, planned inventory purchases, capital investments, debt payments, and collection assumptions align across every reporting package.
- Build a covenant bridge: Explain the movement from the prior quarter to the current projected result. Separate revenue changes, gross-margin changes, payroll investments, interest-rate effects, and one-time items so directors and lenders can see the real drivers.
- Stress-test EBITDA sensitivity: Model what happens to coverage ratios if revenue drops 5% to 10%, collections slow, margins compress, or borrowing costs increase. Use the actual definitions in the credit agreement rather than a simplified proxy.
- Review reporting and covenant deadlines: Late or incomplete reporting can create avoidable lender friction even when financial performance is sound. Assign ownership, create a reporting calendar, and retain support for key adjustments.
- Engage your commercial banker early: If scenario modeling points to tight covenant headroom, contact the lender proactively with historical data, a clear forecast, and a specific operational plan. Early conversations generally create more options than last-minute waiver requests.
A well-prepared board package should connect operations to financing capacity. It should show not only whether the business is in compliance, but also what management is doing to protect liquidity, improve collections, manage spending, and preserve strategic flexibility. By reviewing monthly budget-versus-actuals, cash positions, and covenant forecasts with directors and lenders, management teams build credibility and keep financing options open.
Frequently Asked Questions About Business Cash Management
How much cash should a mid-market company hold during rising interest rate cycles?
Most mid-market businesses operating between $5M and $50M in revenue should maintain three to six months of core operating expenses in accessible cash. The precise amount depends on seasonal burn, client concentration, and gross margins. Companies with predictable recurring revenue can often operate near the three-month mark, while businesses with seasonal sales or longer project cycles need a larger liquidity buffer.
Should businesses use surplus cash to pay down revolving debt or hold liquid reserves?
Compare the interest rate on your revolving line of credit to the yield earned on safe, liquid cash accounts. In a higher-rate environment, paying down variable-rate debt usually delivers a better return, provided your credit line allows immediate redraws and you keep your baseline operational reserves intact.
How do rate hikes impact commercial loan covenants for Q4 reporting?
Rate hikes increase the annual interest expense on variable-rate debt. Because metrics like the Debt Service Coverage Ratio (DSCR) and Fixed-Charge Coverage Ratio (FCCR) include interest in the denominator, higher borrowing costs narrow covenant headroom even if operating EBITDA stays flat.
Conclusion
Navigating a higher-interest-rate environment requires steady financial oversight. By sizing operational reserves carefully, evaluating variable-rate debt paydowns, tightening working capital cycles, and monitoring lender covenants, mid-market business owners can safeguard their liquidity and keep capital allocated effectively.
At MyExec, we deliver fractional CFO and FP&A services tailored for growing businesses. Our flexible model scales from core financial analyst support to senior CFO leadership based on your operational complexity. We've supported companies ranging from a few million dollars in revenue up to roughly $2B across private equity-backed, closely held, nonprofit, and publicly traded environments.
Our team has:
- Implemented cash flow forecasts and rolling 13-month P&L forecasts to improve financial clarity.
- Performed sensitivity and scenario analysis that helped leadership teams make better decisions and improve cash flow and value over time.
- Designed and tracked KPI scorecards covering customer acquisition cost (CAC), average revenue per customer (ARPU), and net revenue retention (NRR).
- Built integrated three-statement models for margin optimization, new product rollouts, and mergers and acquisitions.
- Provided hands-on capital allocation expertise and upgraded monthly reporting packages.

Whether you need support preparing for lender reviews or optimizing working capital, we help you manage financial operations smoothly. When your business grows to the point where a full-time CFO makes sense, we help define the role, select the right candidate, and transition leadership cleanly.
Schedule a 30-minute consultation to review your cash management strategies and balance sheet position this quarter.